
The Muni Catchup 2/13/17

This Week’s ingredients:
- Commentary
- Performance Snapshot
- Flows
- Market Data
- The Bottom Line
Commentary
While there is still speculation about how pending news from Washington will affect the muni bond market (pick your topic: tax reform, infrastructure spending, regulatory reform, postponement of DOL Fiduciary), our suspicion is that those concerns are having less of an effect on flows than the recent decline in muni yields.
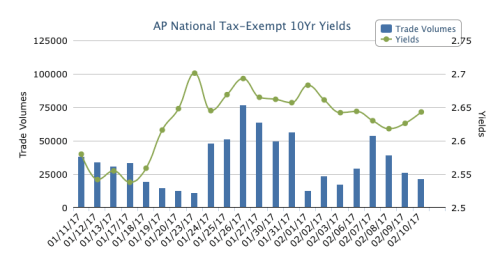
According to MSRB trade data, customer purchases of bonds last week (thru Thursday) were slightly below the year-to-date daily average ($5.4 billion vs YTD $5.5 billion) while customer selling was above average ($4.2 billion vs $3.8 billion). And, even though municipal bond fund flows have still been positive, they have certainly been trending lower after the recent peak in muni yields that occurred around January 23rd. (See Flows and Market Data, below.) While the decline in yields has not been overly dramatic, the change in direction seems to have undone some of the willingness to lock in yields and income.
Back on the topic of fund flows, it is interesting that muni ETFs have been negative the last several weeks, while mutual fund flows have been positive–a reversal from the prior several months.
Looking ahead, the new issue calendar, does not have any “blockbuster” billion dollar deals, but one new issue that will bear watching is a negotiated sale of a New York MTA “green bonds” issue. There are not generally accepted standard criteria for what makes a bond a “green bond,” so it will be interesting to see how the market reacts to this issue. Because of the number of institutional investors with ESG (Environmental, Social and Governance) mandates, this issue of MTA bonds will very likely be heavily oversubscribed….more so than usual. More interesting will be how the yields on this issue will compare to historical MTA issues. Stay tuned!

The Week Ahead:
- Economic Calendar
- New Issue Calendar: $5.5 billion (Last week was $7.5 billion)

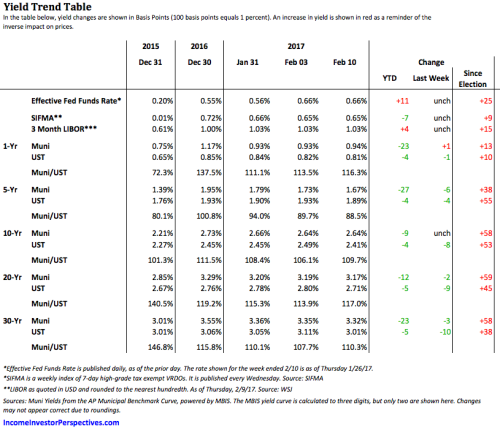
Market Data
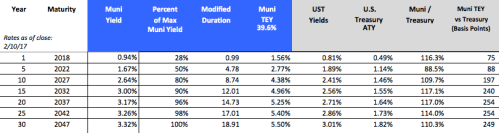
Taxable Equivalent Yields at Different Current and Proposed Federal Income Tax Rates
| Muni Yield | 39.6% | 43.4% (39.6% + 3.8%) | 33% | 25% | 16.5% |
| 3% | 4.96% | 5.30% | 4.47% | 4.00% | 3.59% |
After Tax Yields at Different Current and Proposed Federal Income Tax Rates
| Taxable Yield | 39.6% | 43.4% (39.6% + 3.8%) | 33% | 25% | 16.5% |
| 4% | 2.41% | 2.26% | 2.68% | 3.00% | 3.34% |
The Bottom Line
Market conditions can influence which bonds you buy, but should not be the driver of deciding whether or not you hold bonds at all. Asset allocation should be based on the investment objectives.
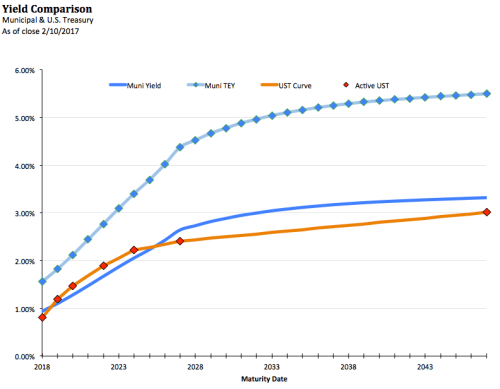
Structure: Barbell For investors building a portfolio from scratch, we continue to favor a barbell, with the expectation that it would be slowly converted to a ladder over the next 1 to 3 years.
Curve: We remain Cautious (underweight your duration target). Going too short on the curve (or overweighting cash or floating rate securities) can mean that there is not enough yield to offset inflation. However, going too long on the curve can mean that there is the potential double whammy of high duration (interest rate risk) combined with lower liquidity.
Structure: Cautious We continue to favor premium bonds for protection from rising rates.
Credit: Cautious Municipal investors need to be very selective in taking on credit risk, especially from issuers with minimal margin of protection. The lower the credit quality, the greater the importance of liquidity, so when taking on more credit risk, be willing to take less than the maximum yield in order to be in a part of the market with more liquidity. As always, our preference for non-investment grade exposure is to use a professional manager via a SMA (Separately Managed Account) or mutual fund, or through an ETF which will offer very low costs and broad diversification. Advisors and self-directed advisors should be sure to read our Muni Risk Radar.
Thank you for reading, and best wishes for a great week,
Pat

We use the AP Municipal Benchmark Curve, Powered by MBIS as our indicator of municipal market yields. The Associated Press (AP) – Municipal Bond Information Service (MBIS) U.S. Tax-Exempt Municipal Index covers the long-term tax-exempt municipal bond market and is based on actual trades and market quotes in the municipal bond market. The curve tracks the offered side of the market and includes smaller transaction sizes to reflect what individual investors may see in the market. The curve assumes 5% coupons with 10 year call protection. The curve is available to subscribers at http://www.mbis.com/apindex/ and is also distributed by The Associated Press to newspapers around the country.
This is not investment advice. The opinions expressed and the information contained herein are based on sources believed to be reliable, but accuracy or appropriateness is not guaranteed and are subject to change without notice. Past performance is interesting but is not a guarantee of future results. Investments in bonds are subject to gains/losses based on the level of interest rates, market conditions and credit quality of the issuer. Indices are not available for direct investment, although in some cases, there may be ETFs available designed to track some of the indices shown. The author does not provide investment, tax, legal or accounting advice. Investors should consult with their own advisor and fully understand their own situation when considering changes to their strategy, tactics or individual investments. Additional information available upon request.
©2017 Patrick F. Luby
All Rights Reserved
