Income Investor Perspectives

Independent municipal bond market insights for advisors

Month: May, 2016

Muni Catchup 5/31

IMG_5515

Welcome to Pat Luby’s Muni Catchup!

Ingredients:

  • Comments
  • Context
  • Performance
  • Flows
  • Notes

Comments

The markets appear to be adjusting to the idea of a Fed rate hike. In the bond markets, while the shorter end of the yield curves have moved slightly higher in yield–the muni curve has moved by less than the Treasury curve, though that is not surprising given the large amounts of new money flowing into the muni market (see Flows, below). With over $100 billion in muni money maturing over the next three months, demand is likely to remain strong, although once the Summer Redemption Season passes, the balance of supply and demand may tilt toward lower prices and (slightly) higher yields. But that is a long way off, and I have never been a fan of trying to forecast rates. (If you haven’t already read my article about Timing Interest Rates, please go read it right now. Come back here when you are done.)

For advisors or investors with matured muni principal to put back to work, if you find it difficult to immediately replace your old bonds with something of comparable quality and characteristics, you can consider using muni ETFs as a placeholder for your muni exposure. I have written a guide to How to Pick the Right Muni ETF. (Of course my subscribers cannot claim that they did not have ample opportunity to provide for reinvestment of their maturing bonds, as I have been writing about Summer Redemption Season for several months.)

Context

Even though most individual investors are (or should be) goal oriented, it is prudent to pay attention to what is going on in the broader bond market. The weekly Context section of my Catchup provides a brief overview of munis versus U.S. Treasury benchmarks. Wondering which maturity to invest in? First of all it will depend on your goal, but if you are open-minded about where to be on the curve, it is helpful to look at the “Percent of Max Yield” in combination with the Modified Duration–you can get a sense of how much of the maximum available yield you can get in comparison to the relative amount of interest rate risk (Duration) you would be taking. Read this article to learn more about the Duration calculation and how to use it.

I suggest that you print out the Context page and keep it by your phone and computer for the week. It is suitable for hanging or wrapping fish. (When I was growing up, every issue of Mad Magazine included an advertisement to order your own copy of the portrait of their famous (and fictitious) “mascot,” Alfred E. Neuman, whose portrait was emblazoned with the question, “What~~Me Worry?”  You may recall that those ads encouraged you to order multiple copies, as they were also suitable for hanging or wrapping fish. “What~~Me Worry?” may be a humorous slogan for a fictitious character, but it is not an appropriate approach to managing your investments. While you may be properly positioned, paying attention to the context of what is going on around you and your investments is always a good idea because market psychology can change so quickly. Hence, I always lead with the Context.

Performance

Duration has been the bond investors’ friend…is that beginning to change? And, are prices on Puerto Rico munis ready to turn the corner?

First, let’s look at Duration. Using the Barclays UST indices as a tool to strip out the credit risk, notice how the Trailing 12-Months returns go up as the Duration goes up, while Month-to-Date returns are mostly negative. It’s interesting to note, though, is that the two longest Duration indices are positive.

With the FOMC now widely expected to hike the Fed Funds rate at their meeting on June 14 & 15, shouldn’t all rates be moving higher? Well no, not necessarily. Because the Fed Funds rate is an overnight lending rate, it has the greatest influence on the short end of the yield curve. Since long-term investors know that the Fed Funds rate will fluctuate over the holding period of a long-term bond, longer-duration rates tend to react more to inflation expectations than to fluctuations in the Fed Funds rate. So while short-maturity yields have moved higher in May, long Treasury yields are back to about where they were at the start of the month. (See the Context page for additional data.)

Screen Shot 2016-05-31 at 4.58.58 AM

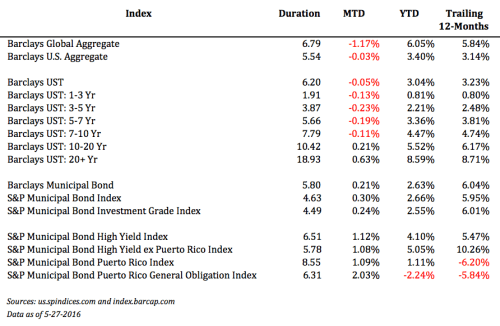
Are the prices on Puerto Rico bonds ready to turn the corner? Note that the two S&P Puerto Rico indices above have positive performance for the Month-to-Date–indicating recently improving prices. While there is MUCH uncertainty that remains for these bonds, the prospect of a bipartisan Federal legislative plan seems to be providing confidence for some speculators to get more active in the last couple of trading sessions. While some Puerto Rico bond prices may have improved lately, they are still speculative investments–it would be premature to expect that prices are ready to turn the corner and head higher. The legislation has not been signed into law, and there are large June 1st payments due. For investors in funds and ETFs with P.R. exposure, you may see improved NAVs as a result of the recent improvement in prices.

NOTE: The indices above are Total Return Indices. Each index is calculated based on the change in price of the underlying baskets of bonds, plus the amount of interest earned in the period. A decline in the price of the basket could still result in a positive Total Return if the amount of interest earned exceeds the price decline. An improving trend (that is, higher rates of return for more recent periods) indicates improving prices for the sector represented by the index. The reverse is also true–a declining trend, in which past returns are higher than recent returns, suggests that the market is expecting diminishing future performance.
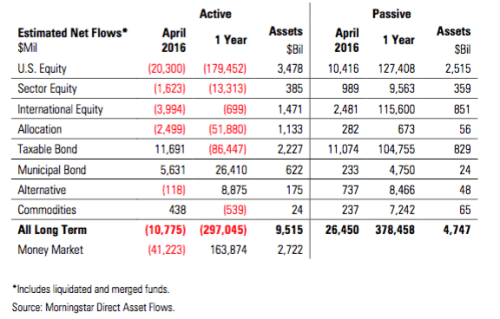
Flows

Based on net flows into muni bond mutual funds and ETFs, demand for professionally managed muni bonds remains very strong. With Summer Redemption Season kicking off in June, a meaningful amount of the $38 billion in maturing June principal may find its way into mutual funds and ETFs, so I would not be surprised to see an additional uptick in net fund in-flows during the weeks ahead.

Screen Shot 2016-05-29 at 1.31.57 PM

Dollar amounts are in millions. Source: Investment Company Institute, May 25, 2016.

Notes

I added a new link to my Links of Note page. Have you checked out my list? Let me know what you think.

Because some weeks will need to have more than one serving of Muni Catchup, each Catchup will now arrive with the date in the headline to help you be sure that you are up to date.

The next Muni Catchup is scheduled for Monday, June 6, but there will be additional updates this week, so if you are not already subscribed, be sure to sign up to be notified by email when they are published.

Comments and questions are welcome and appreciated.

Have a great week,

PatScreen Shot 2016-05-30 at 3.42.52 PM

The opinions expressed and the information contained herein are based on sources believed to be reliable, but accuracy or appropriateness is not guaranteed. Past performance is interesting but is not a guarantee of future results.  Investments in bonds are subject to gains/losses based on the level of interest rates, market conditions and credit quality of the issuer. Indices are not available for direct investment, although in some cases, there may be ETFs available designed to track some of the indices shown.  The author does not provide investment, tax, legal or accounting advice–this is NOT investment advice. Investors should consult with their own advisor and fully understand their own situation when considering changes to their strategy, tactics or individual investments. Additional information available upon request.

Advertisement

Monday Muni Catchup

IMG_5209This week’s Muni Catchup:

  • Context
  • Shifting Flows
  • Hazardous Conditions
  • Coming Attractions
  • And don’t forget…

Context

Screen Shot 2016-05-23 at 8.49.36 AM

Notice anything? Maybe like how U.S. Treasury rates have made a huge move? Ok, maybe not huge, and not big, but they have moved slightly higher, thanks to the chatter about the June FOMC meeting. And, did you also notice how the muni scale didn’t move as much?

Due to continuing very strong demand, the muni market is holding in pretty well. If the FOMC does move or the muni curve moves higher with the UST curve, market prices (and statement prices) can be expected to move lower. This means that there may be an opportunity in here for muni investors with bonds due in the next couple of months that could be sold at a premium to realize the gain now instead of waiting to receive par when their principal is returned. Generally speaking, taking taxable gains on munis is not often tax-efficient unless the holder has losses that can be used to offset against the gains. This is not tax or portfolio advice–consult with your own advisor before taking any action, but it could be worth reviewing your holdings and asking a few questions. This could be particularly worthwhile for investors with bigger portfolios and larger block size (say, 250M and larger). While awaiting the right bonds for reinvestment, don’t let your principal lay around doing nothing…muni ETFs can be used as a good liquid parking spot. If you haven’t used muni ETFs, read about How to Pick the Right Muni Bond ETF and also Duration as a Guide With Muni ETFs so that you can maintain a similar risk exposure.

While we are here (and since I have included the Muni / Treasury Ratio in the table above), let me add a comment about the Muni / Treasury yield ratios. Rather than thinking of the ratio as an indicator of rich / cheap, think of it as a barometer of the market. When the ratio is moving higher, it means “fair weather” in the Treasury market. (The Treasury market is outperforming the muni market.) When the ratio is falling, it means “fair weather” in the Muni market. Since most muni investors (whether individual bonds, mutual funds or ETFs) should be more concerned about how munis will help them reach or satisfy their goals, the fact that munis are extraordinarily cheap versus Treasuries should not–in and of itself–mean that an investor should be adding to their muni position. But the ratios are helpful as a gauge of how the muni market is trading relative to the largest and most liquid global market.

Finally, my apologies to those who are offended when the decimal points don’t line up (and you know who you are). Next time I run it this table, I’ll start working on it a little earlier so that you won’t be distracted by the non-aligned decimals.

Shifting Flows

As noted in last Monday’s update, investors have been shifting many billions of dollars of assets into fixed income. And as I also noted last week, among municipal bond investors, mutual funds seem to have benefited from those flows by a much larger degree than ETFs have. A couple of days ago, the latest monthly U.S. Asset Flows Update from Morningstar Direct confirmed the observation:

Screen Shot 2016-05-18 at 9.17.42 AM

Note that for the trailing 12-months, muni ETFs have attracted 15% of the total new muni asset flows, yet in April mutual funds grabbed 96% of the total muni flows.

If you have comments or insights about why the shift towards active, I’d like to hear from you.

red-flag-908686_960_720Hazardous Conditions

Stay out of the water around Puerto Rico.

Our friend J.R. Rieger, Managing Director and Global Head of Fixed Income for S&P Dow Jones Indices put out an update on Sunday noting that there has been in bounce in the prices for Puerto Rico munis. This doesn’t mean that the coast is clear, but only that there are changing and potentially dangerous currents in the market for Puerto Rico bonds. Here’s the link to his article on Indexology.

Coming Attractions

What are you reading? More to the point, what are you thinking about?

There is a proliferation of summer reading lists, with everyone in the industry seeming to be telling everyone else what to read. I don’t know about you, but summer reading to me is Dirk Pitt, Ken Follett or Robert Ludlum. Maybe with a little Richard Feynman or George Weigel thrown in. Investing classics that are truly classics need to be read–and not just left for summer. So I do have a Summer / Fall / Winter / Spring reading list, but it doesn’t change very much from one year or season to the next unless there is something truly worthy of being added.

Last summer, rather than offering another reading list, I thought it would be more interesting to offer a list of things to think about, to help prepare for the back-end of the year. It was one of my most popular posts of the year.

So be on the lookout for my Summer Thinking List…Memorial Day and the unofficial start of summer are close, so I will be publishing an updated version of my list. This year, though, I will be publishing two lists: one for advisors, and one for investors.

And Don’t Forget…

Summer Redemption Season starts next week! Do you have bonds coming due on June, July or August? Do you have clients with bonds coming due? Should you roll them over into replacement bonds? Should you leave the principal in cash? Should you reallocate into another asset class? Should you use a muni bond mutual fund? Or an ETF? Over $100 billion in principal will be returned to investors in the next three months….where that money flows will have a big impact on the market. I updated the article to show the tops states for June redemptions. Be sure to read it.

The next Muni Catchup will be published Tuesday, May 31. Subscribe now to be notified when it is releasd.

Have a great week,

Pat

The opinions expressed and the information contained herein are based on sources believed to be reliable, but accuracy or appropriateness is not guaranteed. Past performance is interesting but is not a guarantee of future results. The author does not provide investment, tax, legal or accounting advice–this is NOT investment advice. Investors should consult with their own advisor and fully understand their own situation when considering changes to their strategy, tactics or individual investments. Investments in bonds are subject to gains/losses based on the level of interest rates, market conditions and credit quality of the issuer. Additional information available upon request.

Monday Muni Catchup

IMG_5209This week’s Muni Catchup:

  • Context
  • Muni Bond Fund Flows
  • Recap
  • Looking Ahead

Context

An article in the Financial Times (May 12, “U.S. Muni Bonds Unlikely Home for the Huddled Masses,” not linked since it is behind their pay wall) pointed out that an increasing number of non-U.S. investors are buying munis. Why wouldn’t they? Even with the lower yield because of the U.S. Federal tax exemption, muni yields are higher than what is available on many other high quality bonds around the world. When you factor in the lower default risk of munis versus corporates, it is actually surprising that more non-U.S. investors haven’t been bigger buyers of munis. Muni ETFs would be a particularly easy way to access munis. There are even two muni ETFs that specialize in taxable Build America Bonds. Click here to read about how to select a muni ETF.

Muni Bond Fund Flows

For all the headlines about the low-rate environment and objections to putting money into bonds (at least among commentators), investors have in fact been moving money into muni open-end funds and ETFs in a big way. It is interesting to note that after last year, when ETFs claimed a significantly larger percentage of the total flows, this year the proportion has dropped back down to be in line with 2014.

Total Flows Mutual Funds Mutual Fund / Total ETFs ETFs / Total

2014

$31,156 $27,988 90% $3,168 10%
2015

$18,722

$14,792

79%

$3,930

21%

2016 YTD

$23,213

$21,171

91%

$2,042

9%

2016 Annualized*

$67,060 $61,161 91% $5,899

9%

Source: Investment Company Institute weekly statistics release, May 11, 2016. Data as of May 4, 2016. Downloaded from ICI.org. 
*Not seasonally adjusted.

Recap

Heres a recap of what I published last week:

Looking Ahead

  • Due to the Memorial Day Holiday, SIFMA recommends that U.S. bond markets close at 2:00 ET on Friday, May 27, with a full close (of course) on Monday, May 30.
  • Wednesday, June 1 will be the official kick-off of Summer Redemption Season. Of the $38 billion in redemptions expected for June, about 80% will be in the top 16 states (in billions):
    • NJ   $6.6
    • NY  $5.7
    • CA  $5.6
    • FL  $1.8
    • CO  $1.6
    • PA  $1.4
    • OR  $1.3
    • OH  $1.0

Rounding out the rest of the top 16 with less than $1 billion each will be MA, NC, IL, WA, TX, LA, VA and CT.

It will be very interesting to watch to see how much of the maturing bond proceeds get re-directed into muni bond funds or muni ETFs instead of direct purchases of individual bonds.

Have a great week,

Pat

The opinions expressed and the information contained herein are based on sources believed to be reliable, but accuracy or appropriateness is not guaranteed. Past performance is interesting but is not a guarantee of future results. The author does not provide investment, tax, legal or accounting advice–this is NOT investment advice. Investors should consult with their own advisor and fully understand their own situation when considering changes to their strategy, tactics or individual investments. Investments in bonds are subject to gains/losses based on the level of interest rates, market conditions and credit quality of the issuer. Additional information available upon request.

Navigating Puerto Rico

Screen Shot 2016-05-11 at 10.06.27 AMWhile most muni investors probably do not need to be worried about what’s going on with Puerto Rico bonds, everyone should be paying attention because the precedents being set now could affect how easy it will be for the next issuer that feels forced to choose which of their promises to honor.

I have published two articles recently on ETF.com about Puerto Rico and muni ETFs. Read Puerto Rico’s Lesson for ETF Investors for insights about political risk and These ETFs Hold Puerto Rico Munis if you are wondering if you should be selling your ETFs.

You can also visit my author page for other articles about munis and ETFs.

This is not a recommendation to buy, sell or hold any of the securities or strategies mentioned. The author does not provide investment, tax, legal or accounting advice. Investors should consult with their own advisor and fully understand their own situation when considering changes to their strategy, tactics or individual investments. Information is based on sources believed to be reliable, but its accuracy is not guaranteed. Additional information is available upon request.


Muni Monday Catchup


IMG_5209The Yield Curve

How far is too far? How short is too short? Should you go shorter to reduce interest rate risk? Should you go longer to get a positive real return (yield minus inflation rate = real return)? How can you decide without spending so much time that you’ll be late for your tee time?

Investors often draw an artificial line, and decide not to go past that line. That is one reason why there is often an extra bump-up in yield for going slightly longer than 10-years–because a lot of demand gets crowded into the 10-year maturity, there can be less demand and more supply by going just a little longer. I have always paid attention to what percentage of the yield curve is captured by specific spots on the curve. Right now, it looks like this:

  • 60% 14-years
  • 70% 16-years
  • 80% 19-years
  • 90% 23-years

This doesn’t mean you should focus on one of these spots, but it can be a helpful point to keep in mind as you balance risk and return.

The Redemption Wave is Coming

The Summer Redemption Season starts in only a few weeks, and while the expected $100+ billion in redemptions will have an impact on the market, keep in mind that the muni market is not a single homogenous market, but a variety of markets spread across the states and in some cases the sectors as well. So it’s important to keep in mind that the heavy redemption flow starts in a handful of states. Of the $38 billion in redemptions expected for June, about 80% will be in the top 16 states (in billions):

  • NJ   $6.6
  • NY  $5.7
  • CA  $5.6
  • FL  $1.8
  • CO  $1.6
  • PA  $1.4
  • OR  $1.3
  • OH  $1.0

Rounding out the rest of the top 16 with less than $1 billion each will be MA, NC, IL, WA, TX, LA, VA and CT.

Puerto Rico’s Lesson for Muni ETF Investors

It can be hard to find good muni insight as it pertains to ETFs, so I have published a number of articles on ETF.com. The latest came out on Friday. You can check my author page to read my other muni ETF-related articles.

Have a great week!
Pat


The opinions expressed and the information contained herein are based on sources believed to be reliable, but accuracy or appropriateness is not guaranteed. Past performance is interesting but is not a guarantee of future results. The author does not provide investment, tax, legal or accounting advice–this is NOT investment advice. Investors should consult with their own advisor and fully understand their own situation when considering changes to their strategy, tactics or individual investments. Investments in bonds are subject to gains/losses based on the level of interest rates, market conditions and credit quality of the issuer. Additional information available upon request.

May 9, 2016.

©2016 Patrick F. Luby. All rights reserved.

%d bloggers like this: