
Muni Catchup 1/3/2017
 Ingredients:
- Performance Snapshot
- Thoughts on Investing
- Overview
- Were Investors Over-Allocated to Munis?
- What’s on Your Muni Market Risk Radar?
- The Calendar
- New Issue Supply: expect a quiet start
- Fund Flows: ETFs up, mutual funds not.
- Secondary Market Trading
- The Market Now and Then
- The Bottom Line
- And Now…
Performance Snapshot
Thoughts on Investing
“If you accept that anything can happen, then you certainly must make fair allowance for the unexpected.”
James Grant, Forbes Magazine, October 28,2002
Overview
Welcome back! Happy New Year everybody, we hope that you enjoyed a restful holiday break, and are rested and recharged for what should be an interesting year.
No matter what you expected last year, you’ll have to admit that plenty happened that you didn’t expect.
As rates went lower at the beginning of the year, what did you think was going to happen? Did you think rates would keep going lower? Or did you expect the market to give back all of those gains–and more? Or, after watching rates move higher so quickly after the election, did you think that yields would go lower in the last week of the year? After the big move to higher rates, did you expect that the key muni bond total return indices would close in positive territory?
What do you expect for 2017? Where do you think rates are going? How about the Fed? Two rate hikes or three? Inflation? Tax reform? Do you like the market? Do you hate it?
No matter what you think is going to happen, you should “make fair allowance for the unexpected.”
Let’s take a look at some of the recent market trends.
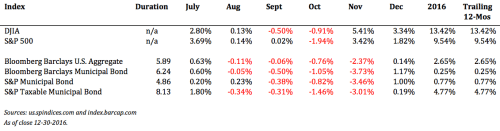
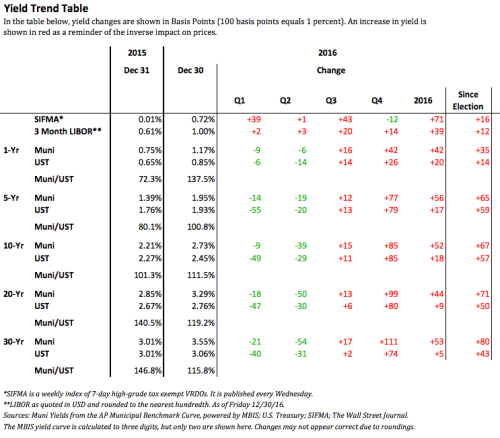
As can be seen in the Yield Trend Table (below), even though rates rose sharply late in the year, the decline in rates in the first half of the year drove performance enough that most of the 206 muni market indices published by S&P Dow Jones closed in positive territory for the year. (Only 42 of the 206 were negative for the year.) But the fourth quarter was volatile–only 10 indices were in positive territory, although that number would have been higher were it not for the improvement in the market in late December. (For December, only 8 of the muni indices had negative total returns.)
Some comments on performance:
- As yields moved higher after the turning point in the market, in many cases, Duration worked against total return.
- The Revenue Bond Index outperformed the G.O. bond index, with Local G.O.s outperforming State G.O.s.
- High Yield had a very challenging fourth quarter, but a good year. The Puerto Rico Index was negative in Q4 but had a strong performance for the year. (We would caution self-directed investors about high yield in general and Puerto Rico specifically–because of the risks involved, we encourage investors to participate in high yield munis only through a professionally managed fund, SMA or broadly diversified ETF.)
See the Performance Snapshot tables, below, for index data.
The record-setting new issue volume combined with the volatile interest rate environment drove trading activity–marking the first time since 2010 when Fall had the heaviest average trading activity for the year–even before Election Day, when volatility and activity spiked up. December 2 had the heaviest daily trade count (62,617 with $21.2 billion total par) since June 25, 2010 (65,137 with $19.4 billion total par).
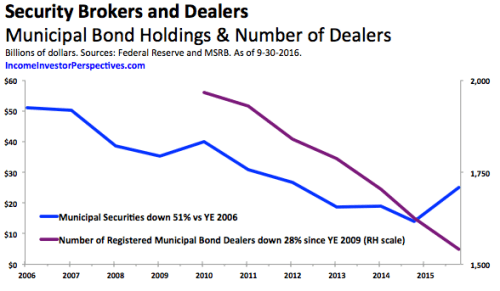
Given the ongoing concerns about secondary market liquidity, the heavy trade activity is actually an encouraging sign for the market. (Particularly since the number of registered municipal bond dealers continues to decline. At the end of 2009, there were 1,967 dealers registered with the MSRB, while as of the end of 2016 the number was 1,413.) The graph below (which we have published before) is only through 3Q16–based on the most recent Fed asset data. The next time it gets updated, the right axis will have to be adjusted and the Malbec colored line will be a little lower.
On the topic of liquidity, it is interesting to note that on Veterans Day (November 11), when the stock market was open and bonds were closed, fixed income ETFs had a robust trading day. For example, AGG traded 8% more in market value than in the period prior to the election, and MUB traded 3% more. HYD–a high yield ETF–traded almost 3 times as much.
UPDATE 1/4: We have an article on ETF.com that dives a little deeper into the topic of fixed income ETF liquidity. You can see more muni ETF articles by going to the ETF.com Author page.
For our prospective thoughts about where to go from here, see The Bottom Line, below.
Were Investors Over-Allocated to Munis?
In the past seven weeks, muni bond mutual funds have lost over $24 billion in assets. That’s about the size of the entire muni ETF market! What’s going on with that?
Generally speaking, if investors’ portfolios are properly allocated across asset classes, a significant shift in the market environment should lead to a change in investment selection rather than a shift out of the asset class. In other words, if muni bond mutual fund investors have suddenly grown uncomfortable with their interest rate risk exposure, they should be shifting to lower duration funds rather than out of the investment class. So does the $24 billion in outflows mean that investors are giving up on munis?
Hardly–while $24 billion is a significant shift in assets, it is important to keep it in context: even after the last seven weeks, total estimated net flows into muni bond mutual funds for 2016 were over $27 billion, bringing total muni bond mutual fund assets to just over $602 billion (according to our estimate). It is possible (probable) that some money has been moved into lower duration muni funds.
The take-away from the massive shift in muni bond fund flows is not that the investment class has lost its appeal, but rather the impact that the loss of demand can have on secondary market prices–especially for longer-maturity (higher risk) bonds. When funds need to raise cash to fund redemptions, given the current market conditions, portfolio managers would be expected to sell long maturity bonds, putting selling pressure on that part of the market, while the dealers would therefore be expected to soften their bid-side. Because mutual funds hold over 20% of the entire municipal bond market, a reduction in buying interest from the funds or an increase in selling pressure from them can have a significant impact on yields. Thus, paying attention to fund flows is important as an indicator of strength or weakness in the market–but not necessarily an indicator of a change in fundamental demand.
What’s on Your Muni Market Risk Radar?
Here’s what’s on ours…these are some of the industry and muni market themes that we will be following this year:
- How will investors react when they see their year-end statement prices?
- U.S. Interest rates and impact on yield curve/portfolio positioning
- Global interest rates
- Fed policy and inflation risks
- Changes in the tax code could affect investor demand
- Outflows from muni bond mutual funds and muni ETFs
- Investor shifts from mutual funds and individual bonds into ETFs
- New issue supply
- ETF product innovation and the risk of over-innovation
- Impact of implementation or delay of the DOL fiduciary rule as well as the potential impact of an increase in “fiduciary” awareness among investors in their non-retirement accounts
- Changes in secondary market liquidity
- Will we see more discount bonds? Are investors aware of the onerous tax treatment for munis that are not subject to the de minimis rule?
- Active vs. Passive (or, as we see it in fixed income, Passive vs. Active vs. Indexed)
- Increase in political risk
- Changes in credit quality and potential reductions in margin of safety
- Decline in oil prices could affet energy producing areas
- Growing awareness of the risks arising from public pension obligations
- Cybersecurity risks (and potential costs) for utilities, hospitals, universities and other large or prominent issuers
- Implications of SEC liquidity management rule for mutual funds (thanks Michael B. for the reminder about this one)
- Fill in the blank_____________________________________________
What do you think is missing from this list?
Depending on where you sit in the industry, you may have a different perspective. For example, mutual fund and separate account managers will need to be able to demonstrate and defend the value-add of active management amidst all of these challenges. (Even though we are proponents of using ETFs to access the muni market, we are of the opinion that the growth in index-based fixed income investments will actually increase the opportunities for active managers to find incremental value in the market.)
Advisors and investors will need to have well-formed opinions about the potential impact on their portfolios of any (or all) of these themes.
The Calendar
The complete economic calendar is available on the MSRB’s EMMA website.
Some other notable dates to keep on your radar:
| 1/16 Monday | Martin Luther King Holiday | all U.S. markets closed |
| 1/20 Friday at Noon ET | Inauguration of Pres. Trump | |
| 1/22 – 1/25 | Inside ETFs | Will you be there? |
| 1/31 – 2/1 | FOMC Meeting | |
| 2/5 Sunday | Super Bowl 51 | |
| 2/20 | Presidents Day Holiday | All U.S. markets closed |
| 3/14 – 3/15 | FOMC Meeting | With Press Conf. |
| 4/10 | DOL Fiduciary Rule | Scheduled to take effect |
| 4/14 | Good Friday | All U.S. markets closed |
| 4/18 Tuesday | Federal Tax Returns Due | Not on the 15th as usual |
| 5/2 – 5/3 | FOMC Meeting | |
| 5/29 | Memorial Day | All U.S. markets closed |
| 7/4 Tuesday | Independence Day | All U.S. markets closed |
| 9/4 | Labor Day | All U.S. markets closed |
| 10/9 Monday | Columbus Day | Stocks open / bonds closed |
| 11/11 Saturday | Veterans Day | Does not fall on a weekday |
| 11/23 | Thanksgiving | All U.S. markets closed |
| 12/25 Monday | Christmas | All U.S. markets closed |
| May, 14 2018 | Deadline for bond dealers to begin disclosing mark-ups on some bond trades | Effective date for new MSRB and FINRA rules. |
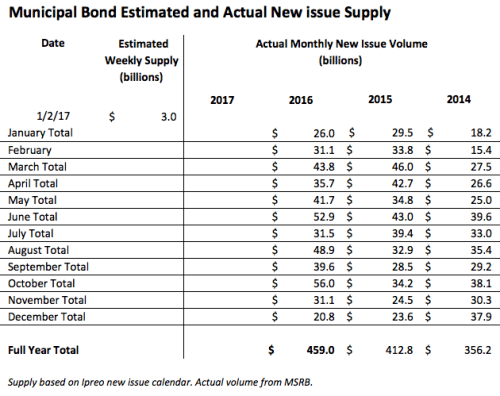
New Issue Supply
Last year’s new issue volume set a record, but we expect this year to get off to a slow start.
Demand Side: Fund Flows
ETFs up three weeks in a row, but mutual funds extend their negative streak to a seventh week.

Demand Side: Secondary Trading

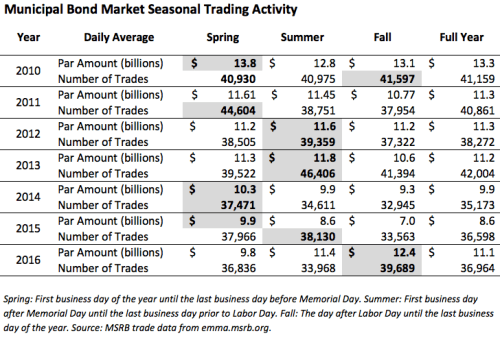
For an explanation of our rationale for looking at muni trading on a seasonal basis, please see “Three Seasons” in the Muni Catchup 9/6/16.
The Market Now and Then
Now: as of last close
Taxable Equivalent Yields of 10-year muni at Different Current and Proposed Federal Income Tax Rates
| Muni Yield | 39.6% | 43.4% (39.6% + 3.8%) | 33% | 25% | 16.5% |
| 2.75% | 4.55% | 4.85% | 4.10% | 3.66% | 3.29% |
After Tax Yields of hypothetical taxable bond at 2.75% taxable yield using Different Current and Proposed Federal Income Tax Rates
| Taxable Yield | 39.6% | 43.4% (39.6% + 3.8%) | 33% | 25% | 16.5% |
| 2.75% | 1.66% | 1.55% | 1.84% | 2.06% | 2.30% |
Relative to taxable bonds of comparable quality, most muni yields are attractive enough that a decline in the Federal income tax brackets would be unlikely to make munis less-attractive than taxables, but it will be important to pay attention to the upcoming debate about possible changes to the tax code.
Then: Performance
Snapshot:
In Depth:
Of the 206 municipal market indices published by S&P Dow Jones:
- For the calendar year, 42 were negative
- In Q4, only 10 were positive
- In December, only 8 were negative

Index junkies and number crunchers should visit S&P Dow Jones Indices Municipal Bond Page for additional performance data.
The Bottom Line
Buy? Sell? Hold?
We continue to favor low duration and high cash flow (premium) bonds in order to be able to maintain an appropriate asset allocation with minimal interest rate risk exposure and to have more funds available for reinvestment if rates continue to move higher.
Tax-Loss Swaps: It is not too late to consider realizing losses, especially from long-duration positions. In order to maintain an appropriate asset allocation exposure, consider lower-duration solutions for the buy-side of swaps. Shorter duration muni ETFs can be used as a placeholder. See my article here for additional guidance on selecting a muni ETF.
Curve: The muni curve begins to flatten around the 10-year maturity range, but the interest rate risk at that spot of the curve may be a little bit too much, at least for the time being. Continue to favor the short end of your target maturity range.
Structure / Credit: Because of the risk of adverse tax consequences, avoid lower coupon bonds that would be at risk of getting priced at a discount if rates move a little higher. Favor premium bonds and good call protection. Because of the sell-off in the market and reduced dealer liquidity, some lower quality bonds have been trading at very attractive levels, but that reduced liquidity means that self-directed investors must do their homework carefully before buying a lower quality bond that may be difficult to sell in the future.
And Now, a Word From Our Sponsor
If you or your firm are wondering about how to apply any of this to your conversations, please contact me. My specialty is helping advisors through the decision-making process of which muni bonds, funds, ETFs, CEFs or SMAs to consider for their clients. Click here for additional ideas about how you can take advantage of my expertise.
Thank you for reading, and best wishes for a prosperous year,
Pat

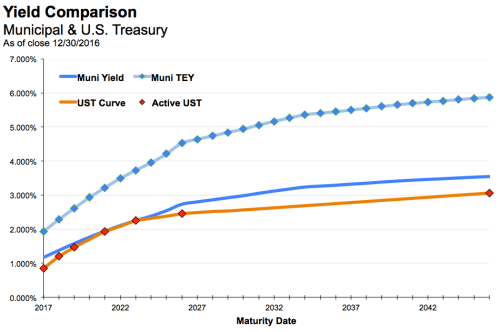
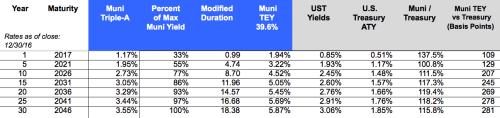
We use the AP Municipal Benchmark Curve, Powered by MBIS as our indicator of municipal market yields. The Associated Press (AP) – Municipal Bond Information Service (MBIS) U.S. Tax-Exempt Municipal Index covers the long-term tax-exempt municipal bond market and is based on actual trades and market quotes in the municipal bond market. The curve tracks the offered side of the market and includes smaller transaction sizes to reflect what individual investors may see in the market. The curve assumes 5% coupons with 10 year call protection. The curve is available to subscribers at http://www.mbis.com/apindex/ and is also distributed by The Associated Press to newspapers around the country.
This is not investment advice. The opinions expressed and the information contained herein are based on sources believed to be reliable, but accuracy or appropriateness is not guaranteed and are subject to change without notice. Past performance is interesting but is not a guarantee of future results. Investments in bonds are subject to gains/losses based on the level of interest rates, market conditions and credit quality of the issuer. Indices are not available for direct investment, although in some cases, there may be ETFs available designed to track some of the indices shown. The author does not provide investment, tax, legal or accounting advice. Investors should consult with their own advisor and fully understand their own situation when considering changes to their strategy, tactics or individual investments. Additional information available upon request.
©2017 Patrick F. Luby
All Rights Reserved
