
Muni Catchup 12/12

The muni market out-performed the U.S. Treasury market last week and trading volume continues to be unseasonably heavy–not surprising given the heavy outflows from mutual funds, the large new issue calendar and yields that started the week at much cheaper levels than have been seen in a while.
The week ahead, however, brings a much smaller new issue calendar and of course the much-anticipated December FOMC meeting.
This Week’s Ingredients:
- It’s Fed Week Again!
- The Muni Market is Less Illiquid!
- Market Performance: Price Rally Follows the Yield Rally
- Three Seasons: Fall is the New Summer
- Muni Bond Fund Flows
- Banks, Insurance Companies and Foreigners Big Buyers of Munis in Q3
- The Calendar
- Muni Market Data and Tables
- The Bottom Line
It’s Fed Week Again!
Here’s the “big picture.” We’ll update this later in the week when we have a new “dot plot.”
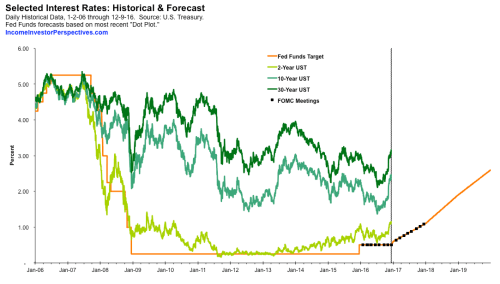
Click here to view the chart above as a PDF.
The Muni Market is Less Illiquid!
Muni market liquidity has improved this year.
After declining for five years, the amount of assets devoted by the broker/dealers to supporting the municipal bond market has ticked up this year.
While most municipal market participants agree that liquidity in the municipal bond market has declined in the last several years, the increased support is an encouraging sign. Taking into account the extremely heavy trading activity in the market this Fall (see Three Seasons, below), it is possible that a higher-rate environment will encourage broader participation in the market and help restore needed liquidity.
This is not to imply that all is well with the municipal bond market–support remains down over 50% from pre-crisis levels and the number of dealers has declined. Advisors and investors should continue to consider potential secondary market liquidity prior to making any buy, sell or even hold decisions.

This chart is not intended to imply complete precision in the amount of capital deployed by the broker/dealer community to the markets, but rather to be indicative of the trend of their level of activity in the markets.
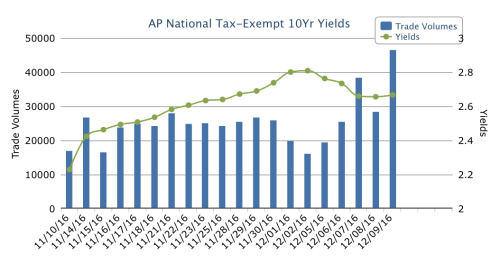
Market Performance: Price Rally Follows the Yield Rally
The chart below of the 10-year spot on the AP MBIS muni yield curve highlights that as yields starting moving higher more quickly, trade volume dropped, until yields peaked and trade volume jumped.
As shown in the Yield Trend Table below, muni yields dropped last week even as U.S. Treasury yields continued to move higher. The two major muni market total return indices are now positive for the month.

Three Seasons: Fall is the New Summer
An Update on the original article from The Muni Catchup 9/6
Did you know that there are only 3 seasons? Of course you did, but perhaps you never realized it. We’re not talking here about the seasons as defined by the movement of the Earth, but the seasons as defined by human activity and how we actually live our lives each year: New Year’s until Memorial Day, Summer and then the time after Labor Day.
For many years, even though we had to do formal business plans based on quarters and years, our approach has been to schedule activities based on the three major parts of the year. We bring this up because the seasonal patterns in the muni market may surprise you. While most participants may expect that Fall will bring an uptick in business and client activity, in the municipal bond market, the “Fall” season for the last several years has not been the most active.
This year, however, is interrupting that trend.
Municipal Bond Market Trading Activity
| Year | Daily Average | Spring | Summer | Fall | Full Year |
| 2012 | Par Amount | $11.2 | $11.6 | $11.2 | $11.3 |
| Trades | 38,505 | 39,359 | 37,322 | 38,272 | |
| 2013 | Par Amount | $11.3 | $11.8 | $10.6 | $11.2 |
| Trades | 39,522 | 46,406 | 41,394 | 42,004 | |
| 2014 | Par Amount | $10.3 | $9.9 | $9.3 | $9.9 |
| Trades | 37,471 | 34,611 | 32,945 | 35,173 | |
| 2015 | Par Amount | $9.9 | $8.6 | $7.0 | $8.6 |
| Trades | 37,966 | 38,130 | 33,563 | 36,598 | |
| 2016 | Par Amount | $9.8 | $11.4 | $ 12.3 | $10.9 |
| Trades | 36,836 | 33,968 | 38,150 | 36,835 |
Par amounts in billions. Source: MSRB trade data through December 8, 2016.
- Spring: First business day of the year until the last business day before Memorial Day.
- Summer: First business day after Memorial Day until the last business day prior to Labor Day.
- Fall: The day after Labor Day until the last business day of the year.
The heavy activity in the Summer makes sense, given the heavy redemption flows in those months. For the last several years, note that the Fall (or post-Labor Day) season has actually seen lower activity levels than in the prior seasons. As we noted in The Catchup back in September, there were lots of reasons to speculate that activity this year may be heavier in the Fall: heavy new issue supply, the election, the Fed, the change in money-market fund regulations, etc., etc.
Now, with the year almost complete, we are in fact seeing that this year’s Fall activity is shaping up to be the most active in several years. Looking at the detailed trade data below for this year, note that even before election day, daily average market activity for this Fall was already heavier than in the last several years.
2016 Municipal Bond Market Average Daily Trading Activity
| Date | Total Par Amount | Number of Trades | Cust Bot Par Amount | Cust Sold Par Amount |
| Jan | $8,209 | 37,359 | $3,585 | $2,157 |
| Feb | $8,113 | 35,944 | $3,689 | $2,228 |
| Mar | $10,742 | 37,747 | $4,933 | $2,989 |
| Apr | $10,528 | 36,580 | $4,758 | $3,084 |
| May | $10,964 | 36,521 | $5,276 | $3,270 |
| Jun | $12,250 | 36,166 | $5,929 | $3,511 |
| Jul | $10,131 | 32,179 | $4,757 | $3,042 |
| Aug | $12,040 | 33,879 | $6,006 | $3,860 |
| Sep | $12,794 | 34,037 | $6,316 | $4,496 |
| Oct | $11,784 | 35,124 | $6,261 | $3,299 |
| Nov | $10,953 | 36,592 | $5,108 | $3,784 |
| Dec MTD | $16,879 | 57,236 | $7,935 | $5,412 |
| Prior Week (11/28 – 12/2) | $15,384 | 55,986 | $7,840 | $4,546 |
| Last Week (12/5 – 12/8) | $15,877 | 55,759 | $6,738 | $5,537 |
| YTD | $10,969 | 36,385 | $5,241 | $3,318 |
| Seasonal: | ||||
| Spring | $9,774 | 36,836 | $4,477 | $2,763 |
| Summer | $11,435 | 33,968 | $5,568 | $3,474 |
| Fall | $12,316 | 38,150 | $6,071 | $4,006 |
| Fall–before and after Election Day: | ||||
| Sep 6 thru Nov 8 | $12,068 | 34,900 | $6,129 | $3,823 |
| Nov 9 thru Dec 8 | $12,860 | 45,268 | $5,944 | $4,408 |
Par amounts in billions. Source: MSRB trade data through December 8, 2016.

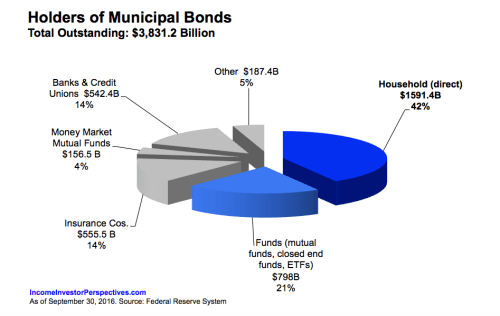
Banks, Insurance Companies and Foreigners Big Buyers of Munis in Q3
According to the newest data about muni bond ownership, individual investors reduced their direct ownership of munis by $6.5 billion in the third quarter, but increased indirect ownership though mutual funds by $13.5 billion.
Other notable Q3 changes in municipal ownership:
- Non-U.S. investors increased their holdings by $3.6 billion. (Not surprising given the negative interest rate world outside of the U.S.)
- Insurance companies increased their holdings. Property and Casualty companies by $3.4 billion and Life companies by $1.8 billion.
- ETFs increased by $1.4 billion. (But regular Catchup readers know that already.)
- Non-muni bond mutual funds hold $17.0 in munis, a decline of $1.6 billion in the quarter, but still a significant increase from the $10.3 billion held at year-end 2015.
- Bank ownership increased by $11.5 billion.
- Money Market Mutual Fund holdings dropped by $57.4 billion. (This is not surprising, given the recent reform in Money Market Mutual Fund regulations.)
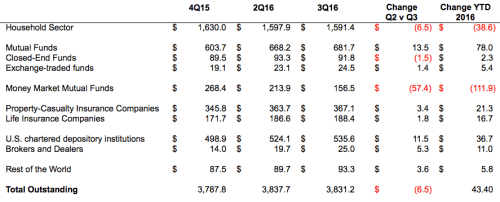
Dollar amounts in billions.
With approximately 8% of munis expected to have been called or matured in 2016, simply maintaining exposure to the investment class can often mean a significant amount of buying.
So even though households are down by over $38 billion year-to-date, individual investors would still have to have been active buyers to have replaced maturing and called bonds. The Fund Flows data (above) do suggest that much of the maturing and called bond proceeds were moved this year from individual bonds into mutual funds, which, because of the recent increase in rates, could be an example of unfortunate timing. While individual bonds do go down in value when interest rates go up, because mutual funds are managed to maintain duration, it can take much longer for their NAVs to recover from a decline in market value than individual bonds will.
The Calendar
| 12/13 & 14 Tue & Wed | FOMC meets | |
| 12/25 Sunday | Christmas Day | |
| 12/25 Sunday | Hanukkah begins | |
| 12/26 Monday | Christmas Observed | all U.S. markets closed |
| 12/30 Friday | Last Trade Date of the year | bonds close early |
| 1/16 Monday | Martin Luther King Holiday | all U.S. markets closed |
| 1/20 Friday at Noon ET | Inauguration of Pres. Trump | |
| 2/5 Sunday | Super Bowl 51 |
Here’s the link to the complete economic calendar on the MSRB’s EMMA website.
Muni Market Data and Tables

The Bottom Line
Buy? Sell? Hold?
Investors appear to have viewed the bump-up in yields as a buying opportunity. If yields remain steady and Treasury yields stabilize, we would not be surprised to see continued buying in munis. We caution investors to keep emotion in check–do not chase yields if they decline significantly. Trading desks will have a reduced risk appetite and after this week, there will be reduced involvement from market participants.
Tax-loss swaps: We continue to encourage investors to consider realizing losses, especially from long-duration positions. In order to maintain an appropriate asset allocation exposure, consider lower-duration solutions for the buy-side of swaps. Shorter duration muni ETFs can be used as a placeholder. See my article here for additional guidance on selecting a muni ETF. With the approach of the holiday shortened weeks, it makes sense to take action sooner rather than later (if appropriate).
Curve: Favor the shorter-end of your maturity range. Keep in mind that even though we have seen a sharp upward move in rates, it is possible that the market could reverse and rates could rally (as we saw this past week), so it is important to both maintain the appropriate asset allocation and also to pay attention to call features so that if rates go lower and stay lower, your bonds do not get called away.
Structure / Credit: With reduced liquidity in the market and the approach of year-end, it continues to make sense to “pay up” for a more liquid bonds: favor single-“A” or better premium bonds. For exposure to lower quality bonds, use a professionally managed vehicle such as a mutual fund, ETF or separately managed account (SMA).
Thanks for Reading
Did you find this through LinkedIn, Twitter or some other source? If so, then you should subscribe right now because there are several special articles planned for the weeks ahead that you will not want to miss. (The subscription form is below.) There is no charge for The Muni Catchup, but if you find it helpful, you can help us by sharing it.
Have a great week,
Pat

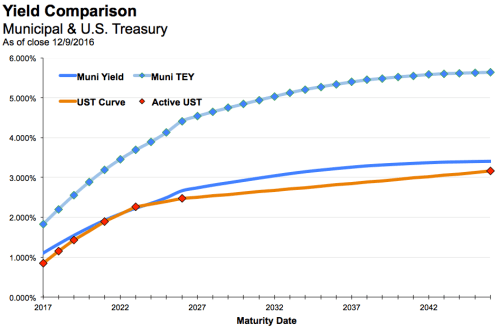
We use the AP Municipal Benchmark Curve, Powered by MBIS as our indicator of municipal market yields. The Associated Press (AP) – Municipal Bond Information Service (MBIS) U.S. Tax-Exempt Municipal Index covers the long-term tax-exempt municipal bond market and is based on actual trades and market quotes in the municipal bond market. The curve tracks the offered side of the market and includes smaller transaction sizes to reflect what individual investors may see in the market. The curve assumes 5% coupons with 10 year call protection. The curve is available to subscribers at http://www.mbis.com/apindex/ and is also distributed by The Associated Press to newspapers around the country.
This is not investment advice. The opinions expressed and the information contained herein are based on sources believed to be reliable, but accuracy or appropriateness is not guaranteed and are subject to change without notice. Past performance is interesting but is not a guarantee of future results. Investments in bonds are subject to gains/losses based on the level of interest rates, market conditions and credit quality of the issuer. Indices are not available for direct investment, although in some cases, there may be ETFs available designed to track some of the indices shown. The author does not provide investment, tax, legal or accounting advice. Investors should consult with their own advisor and fully understand their own situation when considering changes to their strategy, tactics or individual investments. Additional information available upon request.
©2016 Patrick F. Luby
All Rights Reserved
