
Muni Catchup 1/23

This Week’s Ingredients:
- Comments
- Chart of the Week
- Performance Snapshot
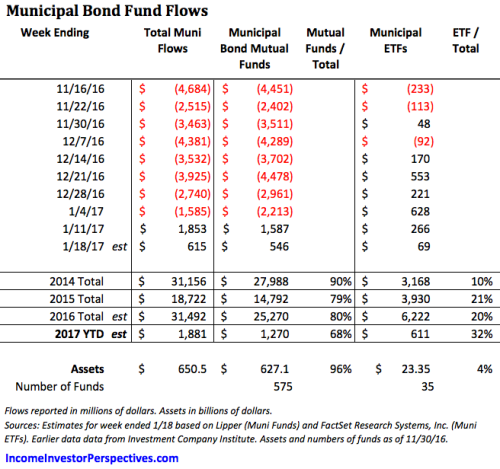
- Fund Flows: still positive
- New Issue Supply: steady
- The Calendar
- Market Data
- Housekeeping: new stuff at IIP!
- The Bottom Line: barbell / underweight duration / conservative structure
Comments
Infrastructure. In the muni market and beyond, there are lots of questions being asked about how the new administration will deliver on candidate Trump’s trillion-dollar infrastructure promise.
The topic came up Friday in President Trump’s Inaugural Speech:
[We’ve] spent trillions of dollars overseas while America’s infrastructure has fallen into disrepair and decay.
We will build new roads, and highways, and bridges, and airports, and tunnels, and railways all across our wonderful nation.
But there is still little clarity. As much as investors and government officials (and citizens) might like to see an immediate increase in new financings for roads, highways, bridges, tunnels, railways, water and sewer systems, renewable energy projects and more, most cities and states are constrained in their borrowing capacity. And, the growing uncertainty surrounding pension and retiree benefits means that future borrowing capacity may be even less. As a result, the question of how the promised infrastructure might affect the muni market is now one of the items on our Muni Risk Radar.
While the need for infrastructure repair and improvement is significant, charting the course of action–and deciding how to pay for those improvements–will take some time.
Stay tuned.
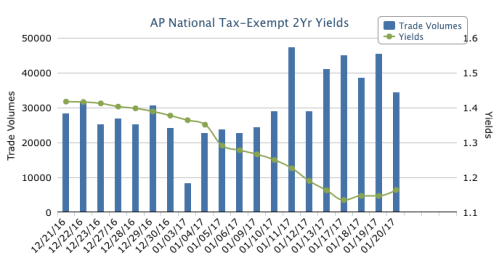
Chart of the Week
The short end of the muni market has had very strong trading volume.
Performance Snapshot

New Issue Supply
- Last week: $9.5 billion
- This week: $6.8 billion
Click to see the complete New Issue Calendar on the MSRB’s EMMA site, which also allows you to see details on the new issues that have recently come to market.
Calendar
- Economic Calendar
- Below are some other notable dates to keep on your radar:
| 1/22 – 1/25 | Inside ETFs | Will you be there? |
| 1/31 – 2/1 | FOMC Meeting | |
| 2/5 Sunday | Super Bowl 51 | |
| 2/20 | Presidents Day Holiday | All U.S. markets closed |
| 3/14 – 3/15 | FOMC Meeting | With Press Conf. |
| 4/10 | DOL Fiduciary Rule | Scheduled to take effect |
| 4/14 | Good Friday | All U.S. markets closed |
| 4/18 Tuesday | Federal Tax Returns Due | Not on the 15th as usual |
| 5/2 – 5/3 | FOMC Meeting | |
| 5/29 | Memorial Day | All U.S. markets closed |
| 7/4 Tuesday | Independence Day | All U.S. markets closed |
| 9/4 | Labor Day | All U.S. markets closed |
| 10/9 Monday | Columbus Day | Stocks open / bonds closed |
| 11/11 Saturday | Veterans Day | Does not fall on a weekday |
| 11/23 | Thanksgiving | All U.S. markets closed |
| 12/25 Monday | Christmas | All U.S. markets closed |
| May, 14 2018 | Deadline for bond dealers to begin disclosing mark-ups on some bond trades | Effective date for new MSRB and FINRA rules. |
Market Data

Housekeeping
 New this week is an updated version of the Muni Risk Radar, which originally appeared in The Catchup earlier this month.Also new this week is The Catchup Archive, to make it easier to go back and see earlier issues of The Muni Catchup.
Both can be found by going to the About Investing page from the top menu.
The Bottom Line
Buy? Sell? Hold? Ladder? Barbell? Bullet?
Structure: Barbell For those who need a refresher about the differences between a ladder, barbell and bullet portfolio structures, see our Glossary. For investors building a portfolio from scratch, we favor a barbell now, with the expectation that it would be slowly converted to a ladder over the next 1 to 3 years.
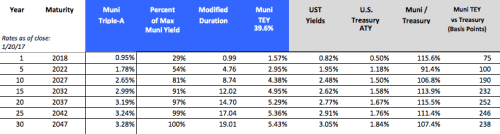
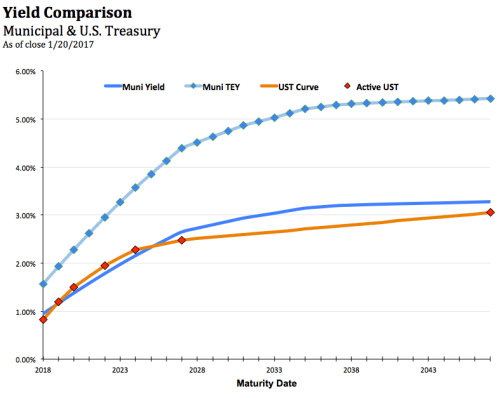
Curve: Cautious (underweight your duration target). Going too short on the curve and there is not enough yield to offset inflation, going too long on the curve and there is the potential double whammy of high duration (interest rate risk) combined with low liquidity. As can be seen in the graph above, there is still a shift in the curve beyond ten years, where incremental duration risk receives much less incremental reward. We have never been in favor of arbitrarily drawing a line at ten years as some investors do, so if there are opportunities to pick up attractive amounts of incremental yield by extending a few years beyond 2028, that may be worth considering.
Structure: Cautious We continue to favor premium bonds for protection from rising rates pushing holdings into a market discount, which can accelerate the decline in market value, due to the onerous tax treatment of market discount that exceeds the “de minimis” exclusion.
Credit: Cautious Perceptions of the economy and credit risk are going to be volatile in the months ahead as the new administration’s proposal are filled in. Municipal investors need to be very selective in taking on credit risk, especially from issuers with minimal margin of protection. The lower the credit quality, the greater the importance of liquidity, so when taking on more credit risk, be willing to take less than the maximum yield in order to be in a part of the market with more liquidity. As always, our preference for non-investment grade exposure is to use a professional manager via a SMA (Separately Managed Account) or mutual fund, or through an ETF which will offer very low costs and broad diversification.
And Now, a Word From Our Sponsor
If you or your firm are wondering about how to apply any of this to your conversations, please contact me. My specialty is helping advisors through the decision-making process of which muni bonds, funds, ETFs, CEFs or SMAs to consider for their clients. Click here for additional ideas about how you can take advantage of my expertise.
If you are at Inside ETFs this week, be sure to let me know so that we can say hello.
Thank you for reading, and best wishes for a great week,
Pat

