Income Investor Perspectives

Independent municipal bond market insights for advisors

Month: June, 2016

Muni Catchup 6/13

Welcome to Pat Luby’s Muni Catchup for June 13, 2016

Screen Shot 2016-05-30 at 3.42.52 PMThe FOMC meets this week, so in anticipation of that, I decided to update one of my favorite charts–even though it will be out of date by Thursday. The chart below shows a forecast for the Fed Funds Target Rate based on the most recent FOMC Dot Plot, a new version of which is expected after this week’s meeting. The visual here is striking, and I show it in case anyone out there is not convinced yet that the Fed needs to adjust their timing for rate hikes, because clearly the market and the now out-of-date Dot Plot are saying two different things.

Screen Shot 2016-06-12 at 6.25.13 PM

Looking at this online–or worse, on your phone–will make you go blind. Click here to open a legal size PDF version of this chart.

The prospect of rising rates is a two-edged sword–of course bond market investors are anxious for higher yields and cash flows, but are concerned about the potential decline in value of their existing holdings. When the Fed does begin to raise rates, it will be because of signs of economic growth. When that happens, other bond market relationships should also be expected to change–such as tightening credit spreads and flattening yield curve, both of which could mitigate potential declines in market values (or NAVs for fund holders). Investors who reinvest their cash flow would benefit almost immediately from higher earnings on their interest payments. (Which is why so many institutional portfolio managers prefer higher coupon bonds–in order to have more cash flow available to reinvest at higher future rates.) Finally–since it has been many years since most bond investors have tweaked their portfolios by using tax-loss swaps, it would be prudent to refresh yourself in the next couple of months about how they work and how to avoid the wash sale rule, so that after Labor Day–if rates are higher, you won’t be scrambling to decide what to do and how to do it.

Recent Rate Trends

As shown above and the table below, rates continued to (mostly) decline last week.

Screen Shot 2016-06-12 at 7.40.47 PM

When compared to U.S. Treasury yields, which obviously benefit from global demand, long muni yields are very attractive. So it is not surprising that last week’s Flow of Funds Report from the Federal Reserve showed that non-U.S. ownership of munis increased by $2 billion in Q1 ’16. Non U.S. investors now hold $89.2 billion in munis. In comparison–muni ETFs–which have been attracting new assets at a speedy clip–held $20.3 billion as of the end of Q1. (If you subscribed you’d have read all of this already, but if you missed it, see the Muni Catchup from 6/10.)

By the way, I have more data about the market on the Muni Market Yields in Context page.

Summer Solstice

Astronomically speaking, summer doesn’t begin until next week–the solstice falls on June 20. But, “Summer Redemption Season,” the three months of heavy muni bond redemption activity–started June 1st, and continues through July and August. (I’ve updated the article with estimated July redemption amounts for key states.)

Screen Shot 2016-06-12 at 8.44.43 PM

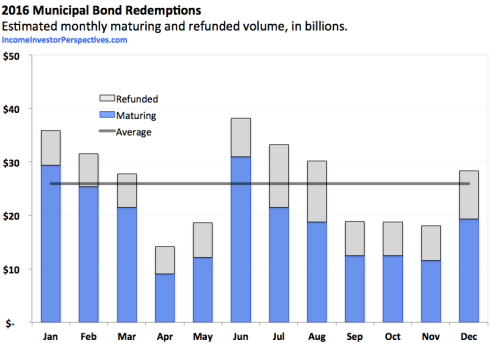
If you have bonds maturing or getting called away, don’t let the returned principal sit around doing nothing until after Labor Day. Plan ahead.

IMG_5515The next regular Muni Catchup is scheduled for Monday, June 20. Since the FOMC is meeting this week, there’s a good chance that there will be an interim update.

If you are not already subscribed, be sure to sign up to be notified by email when new items get published.

If you find this to be helpful, please let me know. Your comments and questions are welcome and appreciated.

Thanks for reading,

Pat

The opinions expressed and the information contained herein are based on sources believed to be reliable, but accuracy or appropriateness is not guaranteed. Past performance is interesting but is not a guarantee of future results. Investments in bonds are subject to gains/losses based on the level of interest rates, market conditions and credit quality of the issuer. Indices are not available for direct investment, although in some cases, there may be ETFs available designed to track some of the indices shown. The author does not provide investment, tax, legal or accounting advice–this is not investment advice. Investors should consult with their own advisor and fully understand their own situation when considering changes to their strategy, tactics or individual investments. Additional information available upon request.

©2016 Patrick F. Luby
All Rights Reserved


Advertisement

Muni Catchup 6/10

Welcome to this special edition of Pat Luby’s Muni Catchup

Funds are Flowing into Munis: The Fed released the quarterly Flow of Funds Report on Thursday, June 9, confirming what many of us already know: that there were substantial inflows into the municipal bond market in Q1 2016:

Screen Shot 2016-06-09 at 4.47.12 PM

The municipal bond market has been and remains dominated by demand from individual investors. Through direct ownership, individuals own 43% of the market. When combined with indirect ownership (through closed and open-end funds and ETFs), individual investors represent almost 2/3rds of the muni bond market.

The first quarter upward trend in muni ownership comes amidst widespread dissatisfaction with interest rates. Yet, equity market volatility, coupled with an increased awareness of goals-based investing seems to be attracting more assets into munis.

Notable increases for the quarter:

  • Household direct ownership +$11.5 billion (up 1%)
  • Mutual Fund ownership +$24.7 billion (up 4%)
  • ETFs +$1.8 billion (up 10%)
  • Property & Casualty Insurance Companies +$2.6 billion (up 1%)
  • Life Insurance Companies +$3.3 billion (up 2%)
  • Non-U.S. ownership +$2.0 billion (up 2%)

In the quarter, even non-muni bond mutual funds added muni bonds to their portfolios, increasing by $2.4 billion to an estimated total of $12.7 billion.

Non-U.S. investors added $2.0 billion in munis, now totalling $89.2 billion. Since even U.S. tax exempt muni yields are often higher than bond yields available in overseas markets, it is not surprising that non-U.S. participation in the muni market is growing. (Consult the Context page for an analysis of benchmark muni yields. Click here to go to the Bloomberg.com Global Bond Benchmarks page to see yields from around the world. Have your magnifying glass handy.)

Money market mutual fund holdings of munis dropped by $29.3 billion, even as total money market mutual fund assets in the quarter increased by $4.1 billion. (Holdings of U.S. Treasury securities increased by $62.6 billion.) As fund managers continue to prepare for the October deadline for implementing a floating NAV on Institutional money market funds, there may be a continued shift of holdings in some money market funds from municipals into more-liquid U.S. Treasury securities.

Muni Market Liquidity: Looking at the amount of financial assets reported by broker-dealers as a proxy for their market-making activities (and therefore the depth of markets) reveals why liquidity in some markets–especially for munis–has declined over the last several years.

Screen Shot 2016-06-09 at 7.06.11 PM

This chart is not intended to imply complete precision in the amount of capital deployed by the broker-dealer community to the markets, but rather to be indicative of the trend of their level of activity in the markets.

Since the end of 2006, while overall market support was down 27%, the estimated amount of broker-dealer assets devoted to supporting the municipal bond market has declined by 63%. The reduced support of the municipal bond market is not surprising, as the trend reinforces the anecdotal observations about the changing nature of secondary market liquidity. The first quarter uptick in munis held by broker/dealers–the first increase since 2010–should be welcome news for investors and portfolio managers.

_____________________________________________________________

If you find this to be helpful, please let me know. You can help me by circulating this and encouraging others to sign up to receive the Muni Catchup.

If you are reading this and today is not June 10th, you should subscribe so that you will receive an immediate e-mail notification every time I publish a new article.

By the way, if you have clients who are under-allocated to fixed income and who have been waiting for rates to go up, I encourage you to read (and share) my article about how to time interest rates. I also recommend my article that explains the benefits of professional management.

As always, your comments and questions are welcome and appreciated.

I’ll be back on Monday with the next regular edition of the Muni Catchup.

Thanks for reading, and best wishes for a great weekend!

Pat

Screen Shot 2016-05-30 at 3.42.52 PM

The opinions expressed and the information contained herein are based on sources believed to be reliable, but accuracy or appropriateness is not guaranteed. Past performance is interesting but is not a guarantee of future results. Investments in bonds are subject to gains/losses based on the level of interest rates, market conditions and credit quality of the issuer. Indices are not available for direct investment, although in some cases, there may be ETFs available designed to track some of the indices shown. The author does not provide investment, tax, legal or accounting advice–this is NOT investment advice. Investors should consult with their own advisor and fully understand their own situation when considering changes to their strategy, tactics or individual investments. Additional information available upon request.


Muni Catchup 6/9

Funds are Flowing into Munis

The Fed released the quarterly Flow of Funds Report today, and it shows that in Q1 2016, funds flowed into munis.

Screen Shot 2016-06-09 at 12.26.08 PM

  • Household ownership +$11.5 billion
  • Mutual Fund ownership +$24.7 billion
  • ETFs +$1.8 billion
  • Non-U.S. ownership +$2.0 billion

A more detailed analysis will be published tonight. If you’re not already signed up, subscribe now to get e-mail announcements sent to your inbox. No spam.

Have a great rest of the day!

Pat


Screen Shot 2016-05-30 at 3.42.52 PM

The opinions expressed and the information contained herein are based on sources believed to be reliable, but accuracy or appropriateness is not guaranteed. Past performance is interesting but is not a guarantee of future results. Investments in bonds are subject to gains/losses based on the level of interest rates, market conditions and credit quality of the issuer. Indices are not available for direct investment, although in some cases, there may be ETFs available designed to track some of the indices shown. The author does not provide investment, tax, legal or accounting advice–this is NOT investment advice. Investors should consult with their own advisor and fully understand their own situation when considering changes to their strategy, tactics or individual investments. Additional information available upon request.


Muni Catchup 6/6

Welcome to Pat Luby’s Muni Catchup for June 6, 2016.

IMG_5515Context

Wow! What a difference a day makes! With the weak unemployment report on Friday, market consensus appears to be that a June rate hike by the Fed is not likely. (Click here to read Bloomberg’s analysis.)

Bond yields reacted by dropping–a lot! In the 5-year spot, muni yields declined by 2 Basis Points (100 Basis Points equals 1 percent), while U.S. Treasuries dropped by 13 BPs. In 10-years, the decline was 2 BPs for munis and 10 for USTs. Thirty yield yields also moved lower, by 5 BPs for munis and 6 for USTs. It is not surprising that the largest moves were in the short-to-intermediate parts of the curve, since historically, changes in monetary policy have had greater influence on the shorter end of the yield curve, while the long end of the curve tends to react more to changes in inflation expectations.

Investors often draw an artificial line in the sand at 10-years, and will not extend into maturities beyond that spot on the curve. As a result, there can be an over-concentration of demand that gets crowded into the 10-year maturity, creating an extra bump-up in yield for going slightly longer than 10-years. Right now, the inflection point–where incremental yield tapers off–can be seen in the 15-to-17 year range. ( See the Yield Comparison graph on the Context page.)

Extending beyond that point offers less incremental yield for taking on the additional Duration risk. As a general guide, it is helpful to pay attention to what percentage of the yield curve is captured by specific spots on the curve. Right now, it looks like this:

60% 14-years
70% 16-years
80% 19-years
90% 22-years

This doesn’t mean you should focus on one of these spots, but it can be a helpful point to keep in mind as you balance risk and return.

The further out you go on the curve, the cheaper that munis become relative to U.S. Treasuries, so it would not be surprising to see some increased muni buying from crossover buyers or non-U.S. fixed income investors.

Investors who have had principal returned from June 1 redemptions may be feeling anxious with the decline in yields–if the right bonds are not immediately available, it may make sense to maintain your exposure to the investment class by using muni bond ETFs. If you haven’t used muni ETFs, read about How to Pick the Right Muni Bond ETF and also Duration as a Guide With Muni ETFs so that you can maintain a similar risk exposure.

_______________________________________________________________

The next regular Muni Catchup is scheduled for Monday, June 13, but there are a couple of specials planned over the next two weeks, so if you are not already subscribed, be sure to sign up to be notified by email when new items get published.

If you find this to be helpful, please let me know. You can help me by circulating this and encouraging others to enjoy the Muni Catchup and IncomeInvestorPerspectives.com

Your comments and questions are welcome and appreciated.

Thanks for reading,

Pat

Screen Shot 2016-05-30 at 10.00.13 AMThe opinions expressed and the information contained herein are based on sources believed to be reliable, but accuracy or appropriateness is not guaranteed. Past performance is interesting but is not a guarantee of future results. Investments in bonds are subject to gains/losses based on the level of interest rates, market conditions and credit quality of the issuer. Indices are not available for direct investment, although in some cases, there may be ETFs available designed to track some of the indices shown. The author does not provide investment, tax, legal or accounting advice–this is NOT investment advice. Investors should consult with their own advisor and fully understand their own situation when considering changes to their strategy, tactics or individual investments. Additional information available upon request.


Muni Catchup 6/1

Screen Shot 2016-05-30 at 3.42.52 PM

Hello Again! Time for a quick Catchup on Performance

May demonstrated what I have said many times, that “low rates do not have to mean low returns.”

As you can see in the Performance Table, below, while most muni bond sectors had positive total returns in May, particularly strong results were shown by the “aggressive” sectors: high yield, tobacco and Puerto Rico. Worth paying attention too is the outperformance of the Revenue Bond Index versus the State G.O. Index.

In the red for the month–as with Treasuries–was the intermediate portion of the muni yield curve, where yields have been ticking higher as the market adjusts to the increasing likelihood of a June rate hike by the Fed. As I wrote for yesterday’s Catchup:

With the FOMC now widely expected to hike the Fed Funds rate at their meeting on June 14 & 15, shouldn’t all rates be moving higher? Well no, not necessarily. Because the Fed Funds rate is an overnight lending rate, it has the greatest influence on the short end of the yield curve. Since long-term investors know that the Fed Funds rate will fluctuate over the holding period of a long-term bond, longer-duration rates tend to react more to inflation expectations than to fluctuations in the Fed Funds rate.

As shown by the recent negative returns, the speculative sectors can taketh away as quickly as they giveth. Investors tempted by the recent strong performance in these parts of the market should strongly consider full-time professional management, at least for that part of their muni bond allocation. A muni portfolio does not need to be all bonds or all funds…it can be a mix and match of bonds, funds, ETFs, CEFs and SMAs. To be prudent, high yield risk needs not only broad diversification but also full-time supervision. If you need convincing, please read my article explaining The Benefits of Professional Management.

Screen Shot 2016-05-31 at 11.27.41 PM

Screen Shot 2016-05-31 at 11.29.23 PM

Performance Table

Returns shown below are not annualized. Links to the source web pages for the indices are available on my Links of Note page.


Screen Shot 2016-06-01 at 6.54.45 AM

The next regular Muni Catchup is scheduled for Monday, June 6, but look for one more special update this week. If you are not already subscribed, be sure to sign up to be notified by email when it gets published.

If you find this to be helpful, please let me know. You can help me by circulating this and encouraging others to enjoy the Muni Catchup and IncomeInvestorPerspectives.com

Your comments and questions are welcome and appreciated.

Thanks for reading,

Pat

The opinions expressed and the information contained herein are based on sources believed to be reliable, but accuracy or appropriateness is not guaranteed. Past performance is interesting but is not a guarantee of future results. Investments in bonds are subject to gains/losses based on the level of interest rates, market conditions and credit quality of the issuer. Indices are not available for direct investment, although in some cases, there may be ETFs available designed to track some of the indices shown. The author does not provide investment, tax, legal or accounting advice–this is NOT investment advice. Investors should consult with their own advisor and fully understand their own situation when considering changes to their strategy, tactics or individual investments. Additional information available upon request.
%d bloggers like this: