Income Investor Perspectives

Independent municipal bond market insights for advisors

Muni Catchup 11/14

screen-shot-2016-07-11-at-6-50-17-am

Oh! That’s Gonna Leave a Mark!

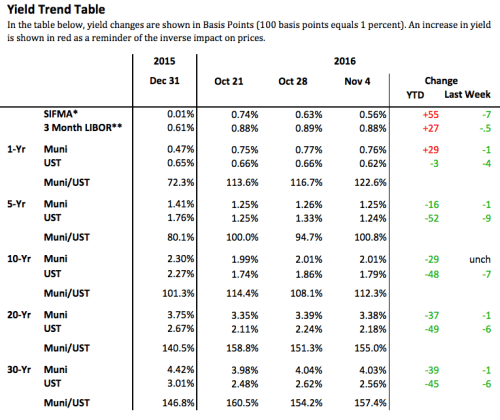
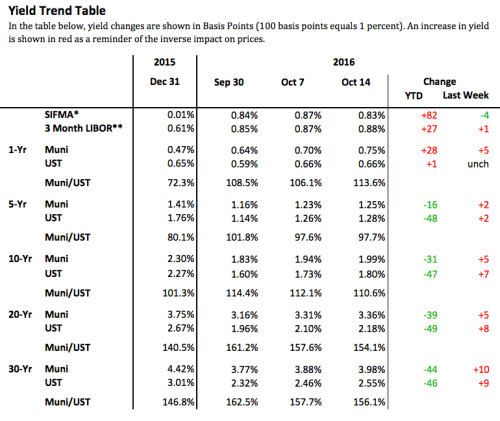
As the U.S. equity market zoomed higher last week, U.S. bond prices moved sharply lower. For example, the yield on the 10-year Treasury Note moved higher by 36 basis points, while the 30-year Treasury Bond moved higher by 38 basis points. (There are 100 basis points in 1 percent.)

screen-shot-2016-11-13-at-4-03-43-pm

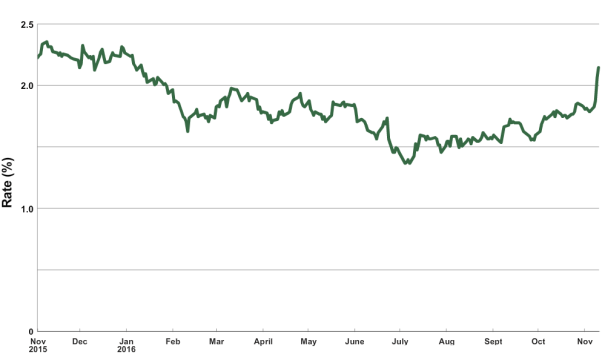
Daily close of the 10-year U.S. Treasury Note.

While 10 and 30-year Treasuries are still lower in yield on the year, they are well above the low yield mark for the year–the 10-year, which closed last week at 2.15% hit 1.37% on July 5. The price declines just in the last week will have a significant effect on the market in a couple of ways:

  • Traders will be looking to protect their trading profits for the year (and therefore their bonuses), and will be very cautious in the few weeks remaining in the year–potentially reducing liquidity even more.
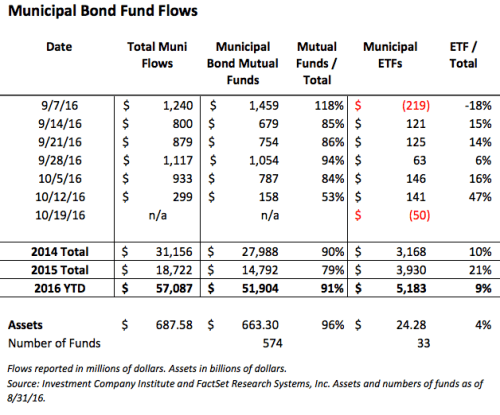
  • Investors have slowed their buying pace in the past couple of weeks (see the Fund Flows and Trading Activity as indicators), and are unlikely to aggressively jump in unless yields stabilize or continue to move higher and get to some “round” numbers. A market that simply “drifts” to higher yields will make it difficult to attract investors.

Here is some insight from this week’s Barron’s:

You heard it here first: Jeffrey Gundlach, CEO of DoubleLine Capital and one of the world’s most successful bond investors, predicted in January at the Barron’s Roundtable that Donald J. Trump would be the country’s next president, noting, “The populist momentum is unstoppable.”

Now that the New York businessman has shocked much of the world by vanquishing rival Hillary Clinton, Gundlach sees something else unstoppable: a rise in bond yields that could lift the yield on the 10-year Treasury note to 6% in the next four or five years.

Trump’s pro-business agenda is inherently “unfriendly” to bonds, Gundlach says, as it could to lead to stronger economic growth and renewed inflation. Gundlach expects President-elect Trump to “amp up the deficit” to pay for infrastructure projects and other programs. That could produce an inflation rate of 3% and nominal growth of 4% to 6% in gross domestic product. “If nominal GDP pushes toward 4%, 5%, or even 6%, there is no way you are going to get bond yields to stay below 2%,” he says.

“Gundlach: Bond Yields Could Hit 6% in Five Years,” by Lauren R. Rubin, Barron’s. November 12, 2016. Barron’s subscribers can link to the article here.

While 6% is a long way from current rates, a steady climb to 6% over 5 years could still result in positive total returns in the interim, albeit well below what we have seen recently.

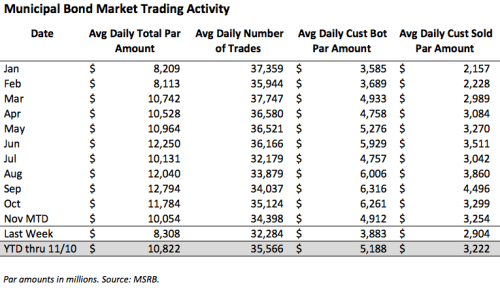
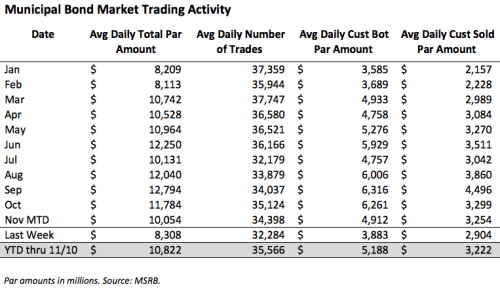
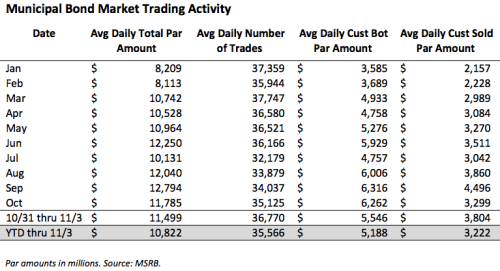
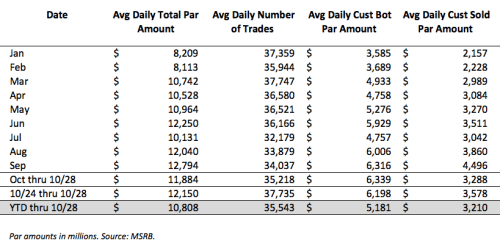
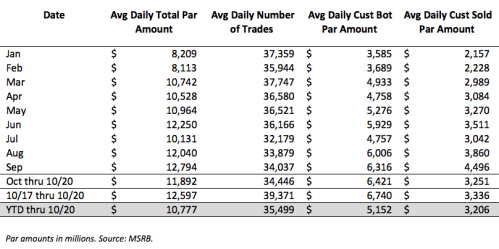
Unsurprisingly, municipal bond market trading volume was down last week, with the average daily par amount traded and customer buying both down. Customer selling was also down.

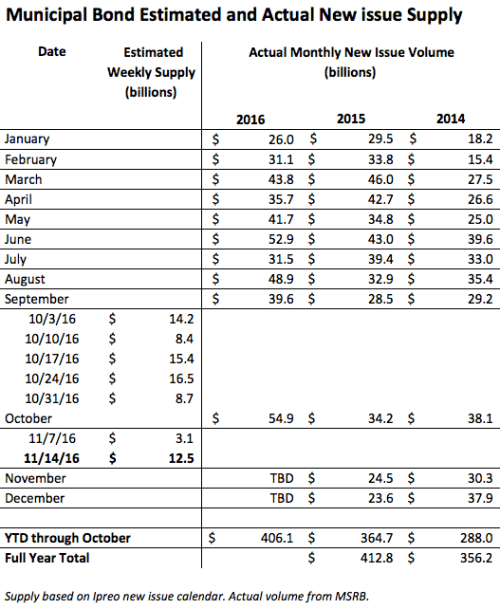
At $12.5 billion, the new issue calendar for this week is heavy–but do not be surprised if deals are delayed, given the dramatic upturn in rates, and decline in trading activity.

screen-shot-2016-11-13-at-5-40-07-pm

Liquidity Update

A letter from the Executive Director of the Municipal Securities Rulemaking Board (MSRB) to the Securities and Exchange Commission identified several areas that could pose a potential risk to retail investors in the municipal bond market. One of the concerns cited was the decline in the number of dealers:

The number of dealer firms in the municipal market continues to decline, which contributes to shrinking inventories. Since October 2012, the number of MSRB-registered dealers is down by 19 percent. This decrease is a result of both the exit of registered dealers from the market, as well as mergers and acquisitions and other consolidation of dealer firms. The combination of a reduction in the dealer population, a decrease in dealer holdings and increasing municipal bond mutual fund balances could lead to reduced liquidity in the municipal market. This type of market dislocation could have a significant impact on mutual fund net asset value (NAV) and the overall value of investors’ municipal bond positions.

Letter from Lynnette Kelly,  Executive Director of the MSRB to the SEC. November 3, 2016.

Most municipal market investors and their advisors would agree that liquidity in the municipal bond market has declined in the last several years. Since the end of 2006, the estimated amount of broker/dealer assets devoted to supporting the municipal bond market has declined by over 60%.

screen-shot-2016-11-13-at-8-34-36-pm

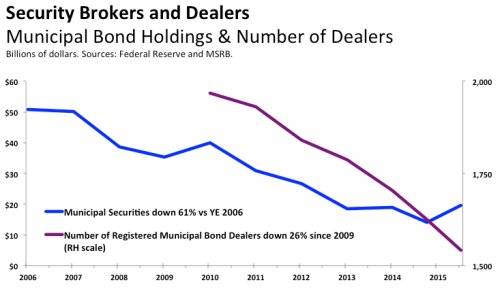
The reduction of broker/dealer support of the municipal bond market is not surprising, as the trend reinforces the anecdotal observations about the changing nature of secondary market liquidity. (This chart is not intended to imply complete precision in the amount of capital deployed by the broker/dealer community to the markets, but rather to be indicative of the trend of their level of activity in the markets.)

The recent reduction of support of the market by broker/dealers has created a tangible reduction in the ability of investors to easily sell or buy on a consistent basis. While this does not mean that investors should reduce or avoid municipal bond investments solely for this reason, it does raise the importance of considering potential secondary market liquidity prior to making any investment decisions.

Self-directed investors must be comfortable with the implications for their own portfolios, or consider if they would prefer delegating portfolio decisions to a professional manager.

Important Note: Change in Data Source

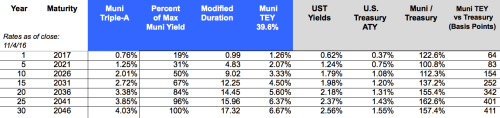
Beginning this week, we are now using the AP Municipal Benchmark Curve, Powered by MBIS as our indicator of municipal market yields. The Associated Press (AP) – Municipal Bond Information Service (MBIS) U.S. Tax-Exempt Municipal Index covers the long-term tax-exempt municipal bond market and is based on actual trades and market quotes in the municipal bond market. The curve tracks the offered side of the market and includes smaller transaction sizes to reflect what individual investors may see in the market. The curve assumes 5% coupons with 10 year call protection. The curve is available to subscribers at http://www.mbis.com/apindex/ and is also distributed by The Associated Press to newspapers around the country.

Reply Hazy Try Again Later

Wow. What a week. Are interest rates ready to turn the corner? Even the trusty Magic 8-Ball isn’t helpful in here. (“Replay hazy try again.”)

screen-shot-2016-11-13-at-1-26-51-pm

Click here for an extended full-page version of the Yield Trend Table showing quarter-by-quarter changes. Suitable for framing or wrapping fish.

screen-shot-2016-11-13-at-3-47-38-pm

screen-shot-2016-11-13-at-3-37-13-pm

The Calendar

11/24 Thursday Thanksgiving Day all U.S. markets closed
12/13 & 14 Tue & Wed FOMC meets
12/25 Sunday Christmas Day
12/25 Sunday Chanakuh begins
12/26 Monday Christmas Observed all U.S. markets closed
12/30 Friday Last Trade Date of the year bonds close early

Here’s the link to the complete economic calendar on the MSRB’s EMMA website.

Market Wisdom

Most stories about investors ruined in the market are stories about lack of diversification.

DollarLogic, by Andy Martin.. Page 195.

The bond market volatility will no doubt send some investors to the sidelines and headline writers to their thesauruses to come up with ever more hyperbolic ways to elicit fear and negativity about bonds. But keep in mind that the pursuit of long-term goals needs a long-term perspective and a diversified portfolio. Last week provided a good example of that–equities did well while most bonds were down. Market conditions should influence the choice of specific investments or strategies, but the asset allocation mix should be determined by the investor’s goals.

The Bottom Line

Demand pressure has been down, and supply pressure could be up this week (maybe). Caution remains the watch word.

screen-shot-2016-11-13-at-3-34-59-pm

Curve: favor the shorter end of your duration range. If the portfolio is overweighted in duration, consider adding very low duration positions to balance long duration holdings. Adding an ETF to an all-bond portfolio can be an effective and quick way to get that done. See my recent article on the topic here.

Credit: the economic numbers suggest an improving economy, but it is premature to “load up” on credit. A modest exposure to credit risk is a good diversifier, however. Exposure to non-investment grade credit risk should be for no more than 10% of the fixed income allocation and should be done using full-time professional management, such as an SMA, mutual fund or ETF.

Structure: continue to favor premium bonds, but be sure to pay attention to portfolio level exposure to call risk and the potential for bonds that are currently priced to the call to get priced to maturity if rates move higher–which would increase duration risk.

Products: fund flows (into mutual funds and ETFs) have slowed dramatically. Do not chase recent performance, but choose funds or SMA strategies based on how the objective fits with the investor’s goals.

Let’s Be Careful Out There!

Thanks for reading, have a great week.

Pat


catchup-bottle-1132-by-468

This is not investment advice. The opinions expressed and the information contained herein are based on sources believed to be reliable, but accuracy or appropriateness is not guaranteed and are subject to change without notice. Past performance is interesting but is not a guarantee of future results. Investments in bonds are subject to gains/losses based on the level of interest rates, market conditions and credit quality of the issuer. Indices are not available for direct investment, although in some cases, there may be ETFs available designed to track some of the indices shown. The author does not provide investment, tax, legal or accounting advice. Investors should consult with their own advisor and fully understand their own situation when considering changes to their strategy, tactics or individual investments. Additional information available upon request.
©2016 Patrick F. Luby
All Rights Reserved

Advertisement

Muni Catchup 11/7

screen-shot-2016-07-11-at-6-50-17-amLast week:

  • Yields down / prices up
  • Heavy supply closing in on a record
  • Uptick in muni ETF flows
  • Customer buying below recent trend / selling slightly above average

This week:

  • Election + Veterans Day Holiday (Friday)
  • Tiny new issue calendar

Plus:

  • Market Wisdom
  • The Bottom Line


screen-shot-2016-11-06-at-9-29-39-pm

screen-shot-2016-11-06-at-2-09-50-pm

*SIFMA is a weekly index of 7-day high-grade tax exempt VRDOs. It is published every Wednesday. 
**LIBOR quoted in USD, as of Thursday 11/3/16.

Benchmark muni yields moved lower last week, influenced no doubt by the volatility in the equity markets. As a result, most total return indices–after several weeks of negative performance–were positive for the week. The price improvements came in spite of customer buying activity that was below recent averages and selling that was up slightly; however, demand would have been helped by the slight uptick in flows into muni ETFs last week.

After another week of heavy new issue supply, the week ahead will be unusually light–good thing, too, with the election and the bond market expected to be closed on Friday. Nonetheless, total new issue volume for the year is close to eclipsing last year’s total, and could surpass the record volume of $433 billion, set in 2010.

screen-shot-2016-11-06-at-8-53-32-pm

screen-shot-2016-11-06-at-3-46-34-pm

screen-shot-2016-11-06-at-2-06-57-pm

The Calendar

U.S. bond markets are scheduled to be closed on Friday in observance of Veterans Day.

11/8 Tuesday Election Day
11/11 Friday Veterans Day stocks open / bonds closed
11/24 Thursday Thanksgiving Day all U.S. markets closed
12/13 & 14 Tue & Wed FOMC meets
12/25 Sunday Christmas Day
12/25 Sunday Chanakuh begins
12/26 Monday Christmas Observed all U.S. markets closed
12/30 Friday Last Trade Date of the year bonds close early

Here’s the link to the complete economic calendar on the MSRB’s EMMA website.

Market Wisdom

The first principle is that you must not fool yourself–and you are the easiest person to fool.

From Surely You’re Joking Mr. Feynman!, by Richard Feynman.

Believe it or not, this book by the Nobel Prize winning physicist Richard Feynman is laugh-out-loud funny. I was prompted to re-read it last week after my friend Barnet Sherman mentioned that he always assigned the last chapter of this book (“Cargo Cult Science”) to interns and new employees. After re-reading the chapter, I decided to re-read the whole book. The chapter and the book are both highly recommended.

The Bottom Line

Supply pressures will be way down, but with the election, demand pressure will also very likely be way down. Caution remains the watch word.

screen-shot-2016-11-06-at-2-09-04-pm

Curve: favor the shorter end of your duration range. While the 13-year spot on the muni curve captures about 60% of the max yield available, a 13-year par bond would have a duration of about 11. Going out to 16-years should capture about 70% of the max yield–but duration there would be around 12.6. In comparison, a 10-year ladder right now (assuming high-grade par bonds) would have a duration of about 5.2, while a 15-year ladder would have a duration of 7.1.

Credit: the economic numbers suggest an improving economy, but it is premature to “load up” on credit. A modest exposure to credit risk is a good diversifier, however. Exposure to non-investment grade credit risk should be for no more than 10% of the fixed income allocation and should be done using full-time professional management, such as an SMA, mutual fund or ETF.

Structure: continue to favor premium bonds, but continue to pay attention to portfolio level exposure to call risk and the potential for bonds that are currently priced to the call to get priced to maturity if rates move higher–which would increase duration risk.

Products: fund flows (into mutual funds and ETFs) are slower than they have been, but remain positive. Do not chase recent performance, but choose funds or SMA strategies based on how the objective fits with the investor’s goals.

Thanks!

Thank you for reading! Have a great week.

Pat

catchup-bottle-1132-by-468This is not investment advice. The opinions expressed and the information contained herein are based on sources believed to be reliable, but accuracy or appropriateness is not guaranteed and are subject to change without notice. Past performance is interesting but is not a guarantee of future results. Investments in bonds are subject to gains/losses based on the level of interest rates, market conditions and credit quality of the issuer. Indices are not available for direct investment, although in some cases, there may be ETFs available designed to track some of the indices shown. The author does not provide investment, tax, legal or accounting advice. Investors should consult with their own advisor and fully understand their own situation when considering changes to their strategy, tactics or individual investments. Additional information available upon request.
©2016 Patrick F. Luby
All Rights Reserved

Muni Catchup 10/31

screen-shot-2016-07-11-at-6-50-17-am

Nope! The Party’s Not Over!

The party may not be over, but it appears to be getting much more subdued. In last week’s Catchup, we noted that Lipper reported an end of the year-long muni inflow party. They reported that for the week ended Wednesday October 19, muni bond mutual funds had net outflows of $27 million–the first weekly net loss in assets in over a year. For the week ended October 26, Lipper reported a net inflow of $256 million. (They report only on muni bond mutual funds–not muni bond ETFs.) The authoritative ICI data always lags Lipper by a week, but preliminary data for muni ETF flows shows a return to positive flows after last week’s net outflows.

screen-shot-2016-10-30-at-4-37-32-pm

Lipper and ICI use different methods to calculate their reports, but the takeaway is not who’s got the numbers exactly right, because they are both reporting a slowdown in flows. The more interesting questions are about the cause, and what investors should be doing.

Likely (or possible) causes: strengthening economy (see Friday’s GDP report) and increasing expectation for a post-election rate hike from the Fed.

What should investors be doing? While the decline in flows suggests that some investors are allocating out of munis, for individual investors, a change in asset allocation is generally appropriate when there is a change in goals or situation–not a change in the market. A change in market conditions can be more appropriately reflected in a change in security selection or risk exposure. In other words, a change in duration or credit risk exposure. It would make us feel better if the muni fund flows showed assets moving within the investment class rather than exiting…that suggests some investors trying to time rates, which is notoriously difficult.

See The Bottom Line, below, for more specific thoughts.

Supply

This week’s new issue supply is expected to be only the single-digit billions, which should take some pressure off the market.

screen-shot-2016-10-30-at-4-41-44-pm

Trading Activity

Last week’s trading activity was higher than the month-to-date average–not surprising given the extremely heavy new issue activity. Notice, though, that the pace of customer buying is below the pace of the month–also not surprising, given the slackening flows into funds and growing expectations of a Fed rate hike soon.

screen-shot-2016-10-31-at-10-43-16-am

Market Wisdom

The shorter a portfolio’s duration, the more frequently maintenance is required.

From Managing a Family-Fixed Income Portfolio by Aaron S. Gurwitz.

Portfolio maintenance adds to costs–so shortening duration to reduce interest rate risk is not a cost-free solution for portfolios. Because of the likelihood of higher security turnover, consider using a muni ETF for temporary low duration exposure.

The Calendar

There’s always a lot on the calendar, so the trick is paying attention to the couple of things that may not be on the calendar or that may be overlooked. There are 9 weeks left in the year, and 4 of those weeks will be “impaired”: affected by holidays and/or major events: such as election day or market holidays. Below is the link to the complete economic calendar, and here are some key events to keep in mind:

11/1 & 2 Tue & Wed FOMC meets
11/2 & 3 Wed & Thu Inside ETFs: Inside Fixed Income 2016
11/6 Sunday End of Daylight Savings
11/8 Tuesday Election Day
11/11 Friday Veterans Day stocks open / bonds closed
11/24 Thursday Thanksgiving Day all U.S. markets closed
12/13 & 14 Tue & Wed FOMC meets
12/25 Sunday Christmas Day
12/25 Sunday Chanakuh begins
12/26 Monday Christmas Observed all U.S. markets closed
12/30 Friday Last Trade Date of the year bonds close early

Here’s the link to the complete economic calendar on the MSRB’s EMMA website.

The Bottom Line

While some of the supply pressures have eased this week, the upcoming partial weeks will also likely reduce new issue supply. However, investors will be distracted by the election and then focused on the potential post-election impact on the markets. Caution remains the watch word.

Curve: favor the shorter end of your duration range.

Credit: the economic numbers suggest an improving economy, but it is premature to “load up” on credit. A modest exposure to credit risk is a good diversifier, however. Exposure to non-investment grade credit risk should be for no more than 10% of the fixed income allocation and should be done using full-time professional management, such as an SMA, mutual fund or ETF.

Structure: continue to favor premium bonds, but pay attention to portfolio level exposure to call risk and the potential for bonds that are currently priced to the call to get priced to maturity if rates move higher–which would increase duration risk. (This is called extension risk.)

Products: slowing flows into funds will reverberate throughout the market. Do not chase recent performance! Select funds or SMA strategies based on how the objective fits with the investor’s goals.

Thanks!

Thanks for reading! Have a great week.

Pat

catchup-bottle-1132-by-468

This is not investment advice. The opinions expressed and the information contained herein are based on sources believed to be reliable, but accuracy or appropriateness is not guaranteed and are subject to change without notice. Past performance is interesting but is not a guarantee of future results. Investments in bonds are subject to gains/losses based on the level of interest rates, market conditions and credit quality of the issuer. Indices are not available for direct investment, although in some cases, there may be ETFs available designed to track some of the indices shown. The author does not provide investment, tax, legal or accounting advice. Investors should consult with their own advisor and fully understand their own situation when considering changes to their strategy, tactics or individual investments. Additional information available upon request.
©2016 Patrick F. Luby
All Rights Reserved


Muni Catchup 10/24

screen-shot-2016-07-11-at-6-52-25-am

This week in The Muni Catchup:

  • Is The Muni Party Over?
    • A look at trading flows, new issue supply and muni ETFs can offer some insight…
  • Market Wisdom
  • Are You Going to be in Newport Beach Next Month?
  • The Bottom Line

screen-shot-2016-10-22-at-4-32-38-pm

Is The Muni Party Over?

Last week, Lipper US Fund Flows estimated that for the week ended Wednesday October 19, muni bond mutual funds had net outflows of $27 million–that’s the first weekly net loss in assets in over a year. The Muni Catchup relies on the weekly data reported by The Investment Company Institute (ICI), which lags the Lipper data by a week. However, based on this week’s muni ETF flows (below), which were also negative, we expect that ICI will likely also report negative flows for the same period. See the Context page for additional data. Keep in mind, though, that 2016 flows already greatly exceed the flows of the last couple of years–suggesting that the flows are influenced by the aging demographics of the baby-boomers as their portfolios enter the de-accumulation phase and the need to generate investment income. Demographics won’t change as a result of changes in market sentiment.

screen-shot-2016-10-23-at-4-44-02-pm

So does this mean that the muni party is over? Based the recent levels of trading activity, it doesn’t look like it:

screen-shot-2016-10-23-at-2-57-04-pm

Certainly, the recent very heavy new issue calendar has helped to drive trading activity, and will likely do so again this week with $16.5 billion expected to be priced.

But what should we read into the first week of negative muni fund flows in a year? There is a risk of over-analyzing these data or reading too much into them, but it can be helpful to look at what is going on with muni ETFs, because it is easier to summarize 35 ETFs than 574 open-end funds. If investors are indeed turning negative on municipals, then we might expect to see outflows across the entire universe of muni ETFs. On the other hand, if investors are reacting to an expected rise in interest rates, we should see flows out of longer duration ETFs and into shorter duration ETFs. The data below–sorted by duration–are from FactSet (via ETF.com) through October 20:

screen-shot-2016-10-23-at-3-50-03-pm

To summarize:

  • The new issue calendar remains very heavy, suggesting that new issues may have to be priced “attractively” in order to clear the market
  • Trading activity this month has been heavier than the YTD average
  • ETF investors appear to be favoring shorter duration ETFs
  • Year-to-date, most muni market total return indices are in positive territory, even though price action for the last several months has been negative

The party does not appear to be over, but participants appear to be taking a more cautious stance, rather than exiting munis. See The Bottom Line (below) for our thoughts on the implications.

screen-shot-2016-10-22-at-4-35-22-pm

Market Wisdom

I believe that to solve any problem that has never been solved before, you have to leave the door to the unknown ajar. You have to permit the possibility that you do not have it exactly right.

From The Meaning of It All, by Richard P. Feynman, winner of the 1965 Nobel Prize in Physics.

While Feynman made this comment in a lecture on the uncertainty of science, I believe that it also applies to investing. Because the objectives and risk tolerances of every investor are unique, the planning and implementation processes are solving for a goal that has not been solved before, so there must be an allowance for the possibility that “you do not have it exactly right.” In practical terms, that is why the regular review of objectives and the portfolio are so important.

Are You Going to be in Newport Beach Next Month?

You know, for the world’s largest fixed income ETF conference? If so, please let me know in advance so we can say “hello.” If you haven’t made plans yet, it’s not too late.

In addition to hearing other fixed income luminaries, you can hear me present “The Case For Muni Bonds: Active vs. Passive In The Puerto Rico Era.”

Click here to see the complete agenda or to reserve a seat.

screen-shot-2016-10-10-at-5-38-27-pm

The Bottom Line

Curve: We re-emphasize our cautious stance. Even with last week’s slight price improvement, the recent weakness in the bond market and the heavy new issue supply and growing expectations for a December rate hike from the Fed combine to encourage an underweight in duration. (For the sake of comparison, based on current rates and assuming par bonds, a 15-year laddered muni portfolio would have a duration of 7.1, and a 10-year ladder would have a duration of 5.2.)

The heavy supply may create some opportunities for investors to pick up some attractively priced bonds both in the primary and secondary market, but with the cautious stance, we remind readers to not stretch for yield–set your duration target to the lower end of your range and seek out the best available combination of risk and yield.

Credit: Holding a modest amount of credit risk can add some incremental income as well as diversification. If the economy continues to improve and pushes rates higher, that should also tighten credit spreads, which could offset some of the duration risk. But as always, when thinking about adding non-investment grade bonds, consider hiring a professional manager–either through an SMA, mutual fund or an ETF.

Structure: Premium bonds remain favored for their lower duration and higher cash flow.

Calls: Beware of the total call risk in portfolios, and watch out for extension risk with bonds priced to a call.

Products: Muni bond mutual fund and ETF inflows have dwindled and may remain negative in the weeks ahead, putting pressure on market prices and on NAVs.

Have a great week, and thanks for reading. Let me know if you have any questions.

Pat

catchup-bottle-1132-by-468


This is not investment advice. The opinions expressed and the information contained herein are based on sources believed to be reliable, but accuracy or appropriateness is not guaranteed and are subject to change without notice. Past performance is interesting but is not a guarantee of future results. Investments in bonds are subject to gains/losses based on the level of interest rates, market conditions and credit quality of the issuer. Indices are not available for direct investment, although in some cases, there may be ETFs available designed to track some of the indices shown. The author does not provide investment, tax, legal or accounting advice. Investors should consult with their own advisor and fully understand their own situation when considering changes to their strategy, tactics or individual investments. Additional information available upon request.
©2016 Patrick F. Luby
All Rights Reserved

Muni Catchup 10/17

screen-shot-2016-07-11-at-6-50-17-amLooking Back

Bond market yields finished the week mostly higher, further eroding the year-to-date total returns for most indices. Nonetheless, if muni ETFs can be used as the bellwether, new money appears to be continuing to flow into the muni market. Weekly total net flows into muni ETFs increased to $150 million from $146 million in the prior week. (Estimated muni ETF flow data are available a week before mutual fund flow data are available. See the Context page for the flow data table.)

screen-shot-2016-10-16-at-9-41-25-pm

screen-shot-2016-10-16-at-9-38-46-pm

Looking Ahead

screen-shot-2016-10-16-at-10-31-04-pm
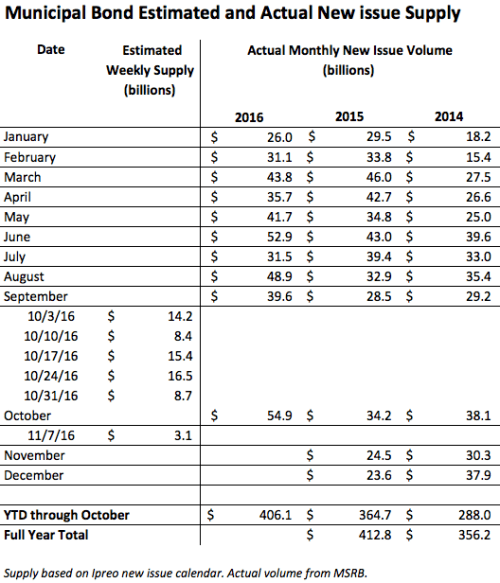
It is notable that just as the bond market is showing signs of weakness, a heavy slate of $15.4 billion in new issues is expected to be offered this week.

Part of what may be driving such heavy supply this week is that in the 11 weeks left in the year, four of them will be shortened by holidays (Veterans Day, Thanksgiving, Christmas and New Year’s), and a fifth week will have the election. Another possible driver of the timing of issuance may be the recent increase in yields–providing incentive for issuers to try to lock in at current rates.

While mutual fund flows have continued, the flows are dwarfed by the supply, so in order to attract sufficient buying interest, do not be surprised if new issue yields are cheapened in order to clear the market, creating some potential buying opportunities–particularly in the secondary market.

Market Wisdom

In accepting the Nobel Prize for economics, Economist  Friedrich Hayek counseled being “apprehensive” regarding “the uncritical acceptance of assertions which have the appearance [emphasis Hayek’s] of being scientific.”

What looks superficially like the most scientific procedure is often the most unscientific, and, beyond this, that in these fields there are definite limits to what we can expect science to achieve. This means that to entrust to science – or to deliberate control according to scientific principles – more than scientific method can achieve may have deplorable effects.

“Friedrich August von Hayek – Prize Lecture: The Pretence of Knowledge”. Nobelprize.org.Nobel Media AB 2014. Web. 7 Dec 2014.

The entire speech is worthwhile reading for any investor or student of economics.

The Bottom Line

Curve: The cautious stance is re-emphasized, given the recent weakness in the bond market and the heavy new issue supply. For investors with new money to put to work or reinvest, favoring the shorter end of the maturity (or duration) target range can make sense.

Credit: Holding a modest amount of credit risk can add some incremental income as well as diversification. If the economy continues to improve and pushes rates higher, that should also tighten credit spreads, which could offset some of the duration risk. But as always, when thinking about adding non-investment grade bonds, consider hiring a professional manager–either through an SMA, mutual fund or an ETF.

Structure: Premium bonds remain favored for their lower duration and higher cash flow.

Calls: Beware of the total call risk in portfolios. If you are going to accept call risk, be sure that you are getting paid to do so.

Products: Muni bond mutual fund and ETF inflows continue to be positive. Favor lower duration solutions. There is a new muni ETF offering that investors can consider as well. MCEF from FirstTrust invests in muni bond closed-end funds, and may offer attractive yields, but beware of the high duration and therefore interest rate risk.

Sellers: Investors who will be selling should pay attention to the new issue calendar and the overall tone of the bond markets.

Have a great week, and thanks for reading. Let me know if you have any questions.

Pat


catchup-bottle-1132-by-468

This is not investment advice. The opinions expressed and the information contained herein are based on sources believed to be reliable, but accuracy or appropriateness is not guaranteed and are subject to change without notice. Past performance is interesting but is not a guarantee of future results. Investments in bonds are subject to gains/losses based on the level of interest rates, market conditions and credit quality of the issuer. Indices are not available for direct investment, although in some cases, there may be ETFs available designed to track some of the indices shown. The author does not provide investment, tax, legal or accounting advice. Investors should consult with their own advisor and fully understand their own situation when considering changes to their strategy, tactics or individual investments. Additional information available upon request.
©2016 Patrick F. Luby
All Rights Reserved


%d bloggers like this: